2024.09.10
ネットワーク解析におけるコミュニティ検出とグラフゼータ関数
グラフ理論とコミュニティ検出
はじめに
こんにちは、グループ研究開発本部 AI研究開発室のM.Mです。
現代社会において、ネットワーク構造は至るところに存在しています。ソーシャルメディア上の人間関係、インターネットの接続構造、タンパク質の相互作用ネットワークなど、様々な分野でネットワーク解析の重要性が高まっています。このような複雑なネットワークを理解し、有用な情報を抽出するための手法として、コミュニティ検出の手法がさまざまに研究・開発されてきました。
コミュニティ検出は、ネットワーク内の密接に結びついたノードのグループを識別する手法で、ネットワークの構造や機能をより深く理解することができます。
一方で今回の表題にあるグラフゼータ関数は、グラフ理論と数論の境界に位置する興味深い概念で、ネットワークの構造的特性を数学的に捉えるツールとして使用することができます。
本記事では、これら2つの概念 – コミュニティ検出とグラフゼータ関数 – を詳しく解説し、両者の関係性や実際のネットワーク解析への応用について探っていきます。さらに、Pythonを用いた実装例を通じて、これらの手法を実践的に理解することを目指します。
申し訳ないのですが厳密な理論的背景などは割愛しますのでご了承ください。
コミュニティ検出
コミュニティ検出の基本概念
コミュニティ検出は、複雑なネットワーク内で密接に関連するノードのグループを識別するプロセスです。これは、ネットワーク科学における重要な課題の一つであり、社会ネットワーク分析、生物学的ネットワーク、ウェブ解析など、様々な分野で応用されています。
コミュニティ検出の主な目的は以下の通りです:
- 構造の理解: ネットワークの全体的な構造と組織を把握する。
- 機能の解明: 類似した機能や役割を持つノードのグループを特定する。
- 情報の要約: 大規模で複雑なネットワークを、より管理しやすい単位に分割する。
- 異常検出: ネットワーク内の通常とは異なるパターンや構造を識別する。
コミュニティの定義は文脈によって異なりますが、一般的には以下の特徴を持つグループを指します:
- 高い内部密度: コミュニティ内のノード間の接続が密である。
- 低い外部密度: コミュニティ間の接続が疎である。
これらの特徴を数学的に表現するために、様々な指標が提案されています。その中でも代表的なものに「モジュラリティ」があります。モジュラリティQは以下の式で定義されます:
Q = \frac{1}{2m} \sum_{i,j} \left(A_{ij} – \frac{k_i k_j}{2m}\right) \delta(c_i, c_j)
\]
ここで、
- m: ネットワーク内の全エッジ数
- Aij: ノード i と j を結ぶエッジの有無(0 または 1)
- ki, kj: ノード i と j の次数(接続数)
- ci, cj: ノード i と j が属するコミュニティ
- δ: クロネッカーのデルタ関数(同じコミュニティなら1、そうでなければ0)
モジュラリティ \( Q \) が高いほど、良質なコミュニティ分割であると考えられます。
主要なアルゴリズムの紹介
コミュニティ検出のための多くのアルゴリズムが提案されていますが、ここでは代表的なものをいくつか紹介します。
1. Girvan-Newman法
アプローチ:エッジ削除による分割(除算的手法)
手順:
- ネットワーク内の全てのエッジのベトウィーンネス中心性を計算
- 最も高いベトウィーンネス中心性を持つエッジを削除
- ステップ1-2を繰り返し、階層的なコミュニティ構造を得る
特徴:直感的で理解しやすいが、計算コストが高い
2. Louvain法
アプローチ:モジュラリティ最適化(凝集的手法)
手順:
- 各ノードを独立したコミュニティとして初期化
- 隣接ノードをそれぞれのコミュニティに移動し、モジュラリティの変化を計算
- モジュラリティが最大になるように、ノードをコミュニティ間で移動
- コミュニティをノードとみなし、ステップ2-3を繰り返す
特徴:高速で大規模ネットワークにも適用可能、しかし解像度限界がある
3. InfoMap法
アプローチ:情報理論に基づくマップ方程式の最小化
手順:
- ランダムウォーカーの動きをエンコードする二層コーディング方式を定義
- コミュニティ構造を変更しながら、エンコーディングの記述長を最小化
特徴:方向性のあるネットワークや重み付きネットワークにも適用可能
4. Label Propagation Algorithm (LPA)
アプローチ:ノードラベルの伝播
手順:
- 各ノードに一意のラベルを割り当てる
- 各ノードのラベルを、最も多くの隣接ノードが持つラベルに更新
- ラベルが収束するまでステップ2を繰り返す
特徴:非常に高速だが、結果が不安定になることがある
これらのアルゴリズムはそれぞれ長所と短所があり、ネットワークの性質や解析の目的に応じて適切なものを選択する必要があります。実際の応用では、複数のアルゴリズムを組み合わせたり、ドメイン知識を取り入れたりすることで、より信頼性の高い結果を得ることができます。
実装例
環境はgoogle colabです。
まず必要なライブラリをまとめて import します。
!pip install python-louvain

import networkx as nx
import numpy as np
import matplotlib.pyplot as plt
import seaborn as sns
import pandas as pd
from scipy import stats
import os
from datetime import datetime
from sklearn.cluster import SpectralClustering
from sklearn.preprocessing import normalize
import networkx as nx
import community as community_louvain
import community.community_louvain as community_louvain
from sklearn.cluster import SpectralClustering, DBSCAN
import matplotlib.colors as mcolors
from sklearn.decomposition import PCA
from sklearn.cluster import KMeans
from scipy.linalg import expm, eigh
from scipy.fftpack import fft
from scipy.linalg import logm
from scipy.spatial.distance import pdist, squareform
from itertools import product
import tqdm
from sklearn.metrics import silhouette_score
import random
コミュニティが存在するグラフを生成します。
def create_complex_graph(n=50, m=1, coorder=False, coord_strength=0.5, seed=None):
    G = nx.barabasi_albert_graph(n, m, seed=seed)

    if coorder:
        num_correlated = int(n * 0.3)
        correlated_nodes = np.random.choice(G.nodes(), num_correlated, replace=False)

        for i in range(len(correlated_nodes)):
            for j in range(i+1, len(correlated_nodes)):
                if G.has_edge(correlated_nodes[i], correlated_nodes[j]):
                    G[correlated_nodes[i]][correlated_nodes[j]]['weight'] = np.random.uniform(0.8, 1.0)
                elif np.random.random() < 0.7 * coord_strength:
                    G.add_edge(correlated_nodes[i], correlated_nodes[j], weight=np.random.uniform(0.8, 1.0))

    for (u, v) in G.edges():
        if 'weight' not in G[u][v]:
            G[u][v]['weight'] = np.random.uniform(0.1, 0.3)

    quantities = {node: np.random.uniform(800, 1000) if coorder and node in correlated_nodes else np.random.uniform(100, 300) for node in G.nodes()}
    nx.set_node_attributes(G, quantities, 'quantity')

    return G

def visualize_graph(G, title, save_path=None):
    fig, ax = plt.subplots(figsize=(16, 10))
    pos = nx.spring_layout(G, k=0.5, iterations=50)

    quantities = nx.get_node_attributes(G, 'quantity')
    eigenvector_centrality = nx.eigenvector_centrality(G, weight='weight', max_iter=1000, tol=1e-06)

    node_sizes = [q / 5 for q in quantities.values()]
    node_colors = list(eigenvector_centrality.values())

    nodes = nx.draw_networkx_nodes(G, pos, node_size=node_sizes, node_color=node_colors,
                                    cmap=plt.cm.viridis, alpha=0.8, ax=ax)

    edge_weights = [G[u][v]['weight'] * 3 for u, v in G.edges()]
    nx.draw_networkx_edges(G, pos, width=edge_weights, alpha=0.5, edge_color='gray', ax=ax)

    labels = {node: f'{node}' for node in G.nodes()}
    nx.draw_networkx_labels(G, pos, labels, font_size=8, font_weight='bold', ax=ax)

    ax.set_title(title, fontsize=16)
    ax.axis('off')

    sm = plt.cm.ScalarMappable(cmap=plt.cm.viridis, norm=plt.Normalize(vmin=min(eigenvector_centrality.values()), vmax=max(eigenvector_centrality.values())))
    sm.set_array([])
    cbar = plt.colorbar(sm, ax=ax, label='Eigenvector Centrality', pad=0.1)
    cbar.ax.tick_params(labelsize=10)

    size_legend_elements = [plt.scatter([], [], s=s/5, c='gray', alpha=0.5, label=f'{s}') for s in [100, 500, 1000]]
    size_legend = ax.legend(handles=size_legend_elements, title='Transaction Quantity', loc='center left', bbox_to_anchor=(-0.1, 0.5), fontsize=10, title_fontsize=12)

    plt.tight_layout()
    # plt.savefig(save_path, bbox_inches='tight', dpi=300)
    plt.show()
    plt.close()


G = create_complex_graph(n=100, m=1, coorder=True, coord_strength=0.7)
visualize_graph(G, 'sample_graph')
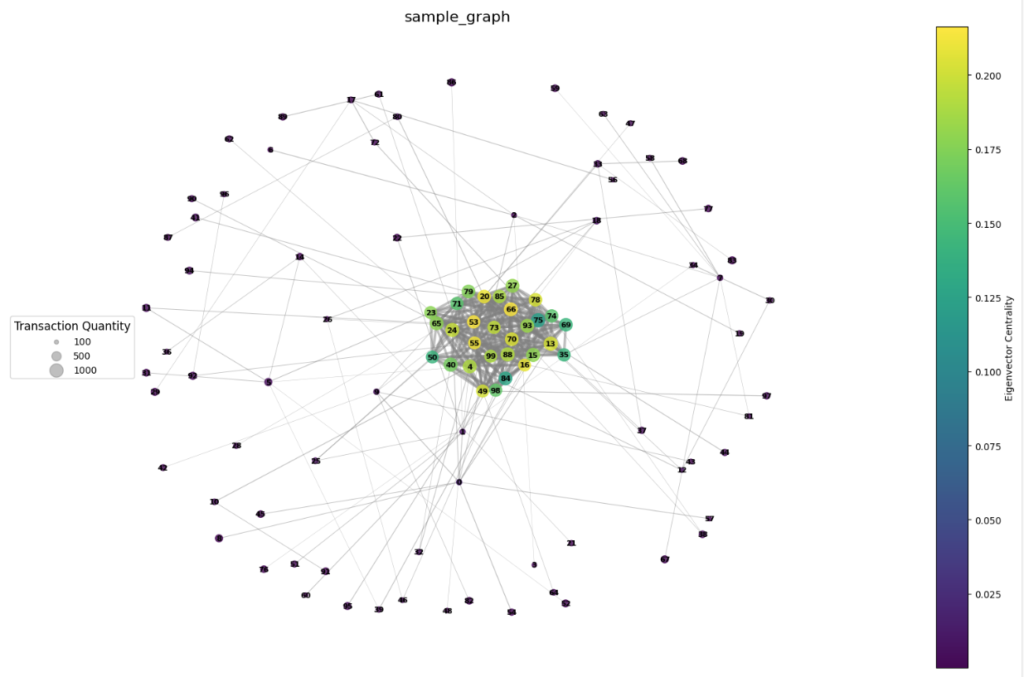
生成したサンプルグラフ
固有ベクトル中心性の値を使用して可視化しました。
上記で挙げた方法であるLouvain法と、他にスペクトラルクラスタリング、中心性とページランクなどを使用して少し工夫したコミュニティ検出の実装を行ってみます。
# Louvain法を用いた中心的なコミュニティ検知
def detect_communities_louvain(G):
    # コミュニティを検出
    partition = community_louvain.best_partition(G, weight='weight')
    # 中心性を考慮した最も大きなコミュニティを選定
    central_community = max(set(partition.values()), key=lambda c: sum(nx.betweenness_centrality(G, weight='weight')[n] for n in G if partition[n] == c))
    # 2つのコミュニティに限定
    return {node: 0 if partition[node] == central_community else 1 for node in G}

# スペクトラルクラスタリングを用いた中心的なコミュニティ検知
def detect_communities_spectral(G, n_clusters=2):
    # 隣接行列の取得と正規化
    adj_matrix = nx.to_numpy_array(G, weight='weight')
    norm_adj_matrix = normalize(adj_matrix, norm='l1', axis=1)
    # スペクトラルクラスタリングの実行
    clustering = SpectralClustering(n_clusters=n_clusters, affinity='precomputed').fit(norm_adj_matrix)
    return clustering.labels_

def classical_analysis(G, n_clusters=2):
    # PageRankの計算
    classical_pagerank = nx.pagerank(G)

    # 中心性の計算
    degree_centrality = nx.degree_centrality(G)
    betweenness_centrality = nx.betweenness_centrality(G)
    closeness_centrality = nx.closeness_centrality(G)
    eigenvector_centrality = nx.eigenvector_centrality(G)

    # 特徴量行列の作成
    features = np.array([list(degree_centrality.values()),
                         list(betweenness_centrality.values()),
                         list(closeness_centrality.values()),
                         list(eigenvector_centrality.values())]).T

    # PCAによる次元削減
    pca = PCA(n_components=2)
    pca_features = pca.fit_transform(features)

    # K-meansクラスタリング
    kmeans = KMeans(n_clusters=n_clusters, random_state=42, n_init=10)
    clusters = kmeans.fit_predict(features)

    return {
        'pagerank': classical_pagerank,
        'pca_features': pca_features,
        'clusters': clusters
    }


# カスタムカラーマップの作成
def generate_community_colors(partition, num_colors):
    # 固定された色リストを使用
    color_list = [
        'tab:blue', 'tab:orange', 'tab:green', 'tab:red',
        'tab:purple', 'tab:brown', 'tab:pink', 'tab:gray',
        'tab:olive', 'tab:cyan'
    ]

    # 必要な色の数が color_list の長さを超える場合、再利用する
    community_colors = {i: mcolors.TABLEAU_COLORS[color_list[i % len(color_list)]] for i in range(num_colors)}
    return community_colors

def visualize_community_graphs(G, partitions, titles, figsize=(20, 10)):
    fig, axes = plt.subplots(1, len(partitions), figsize=figsize)

    # axesがリストでない場合に対応するため、リストに変換
    if len(partitions) == 1:
        axes = [axes]

    pos = nx.spring_layout(G, k=0.5, iterations=50)

    quantities = nx.get_node_attributes(G, 'quantity')
    node_sizes = [q * 7 for q in quantities]

    for i, (partition, title) in enumerate(zip(partitions, titles)):
        ax = axes[i]
        unique_communities = set(partition if isinstance(partition, dict) else partition)
        community_colors = generate_community_colors(partition, len(unique_communities))
        node_colors = [community_colors[partition[node]] if isinstance(partition, dict) else community_colors[partition[node]] for node in G.nodes()]

        nodes = nx.draw_networkx_nodes(G, pos, node_size=node_sizes, node_color=node_colors,
                                       alpha=0.8, ax=ax)

        edge_weights = [G[u][v]['weight'] * 3 for u, v in G.edges()]
        nx.draw_networkx_edges(G, pos, width=edge_weights, alpha=0.5, edge_color='gray', ax=ax)

        labels = {node: f'{node}' for node in G.nodes()}
        nx.draw_networkx_labels(G, pos, labels, font_size=8, font_weight='bold', ax=ax)

        ax.set_title(title, fontsize=16)
        ax.axis('off')

    plt.tight_layout()
    plt.show()


louvain_communities = detect_communities_louvain(G)
spectral_communities = detect_communities_spectral(G)
centrality_communities = classical_analysis(G, n_clusters=2)['clusters']

partitions = [louvain_communities, spectral_communities, centrality_communities]
titles = ["Louvain_Method", "Spectral_Clustering", "K-Means_Clustering_with_Centralities"]

visualize_community_graphs(G, partitions, titles)
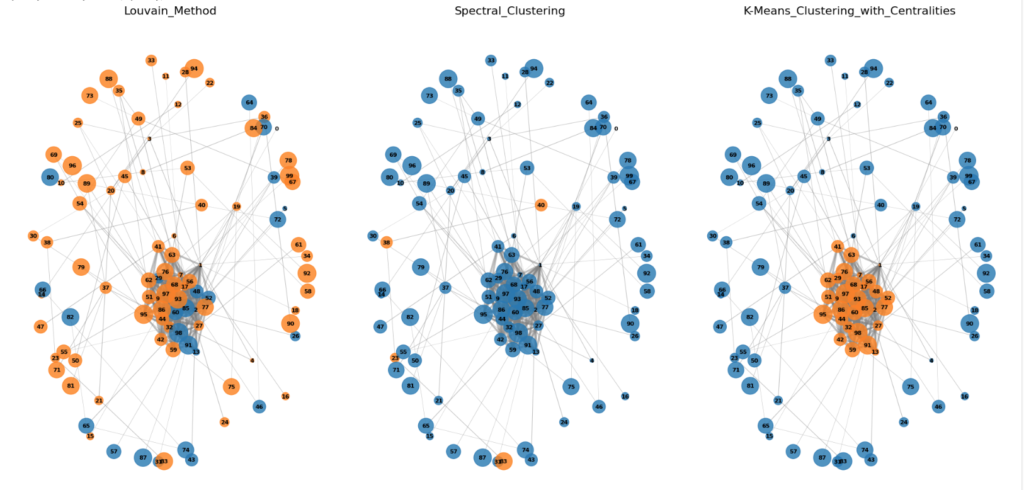
中心性を使用したものはそこそこ良いですね。
スペクトルは少し単純すぎる実装かもしれません。
Iharaの定理
グラフゼータ関数についてはこちらの資料を参考にさせていただきました
グラフのゼータ関数と量子ウォーク:https://u.muroran-it.ac.jp/mathsci/danwakai/past/articles/201104-201203/02-20110920-sato.pdf
G を n 点 v₁,···, vₙ を持つ連結単純グラフとするとき、G の隣接行列 A(G) = (aᵢⱼ)₁≤ᵢ,ⱼ≤ₙ を、vᵢvⱼ ∈ E(G)(あるいは、(vᵢ, vⱼ) ∈ D(G))のとき aᵢⱼ = 1、さもなければ、aᵢⱼ = 0 と定義します。点 vᵢ の次数を、deg G vᵢ = |{vⱼ | vᵢvⱼ ∈ E(G)}| と定義します。G の各点 v について、deg G v = k(一定)のとき、G を k-正則グラフといいます。
定理 1 (Ihara)
G が連結 (q + 1)-正則グラフのとき、G の Ihara ゼータ関数は次のように与えられます:
\[ \mathbf{Z}_G(u) = (1 – u^2)^{-(m-n)} \det(\mathbf{I}_n – \mathbf{A}(G)u + qu^2\mathbf{I}_n)^{-1} = \exp(\sum_{k\geq1} \frac{N_k}{k} u^k). \]
ここで、m = |E(G)|, n = |V(G)| です。また、N_k は G の長さ k の reduced cycles の個数を表します。
非正則グラフの Ihara ゼータ関数
G を n 点 v₁,···, vₙ と、m 辺を持つ連結グラフとするとき、n×n 対角行列 D = (d_ij) を、d_ii = deg G v_i と定義します。また、2つの 2m×2m 行列 B = B(G) = ((B)_e,f)_e,f∈D(G) and J₀ = J₀(G) = ((J₀)_e,f)_e,f∈D(G) を、次のように与えます:
\[ (\mathbf{B})_{e,f} = \begin{cases} 1 & \text{if } t(e) = o(f), \\ 0 & \text{otherwise,} \end{cases} \quad
(\mathbf{J}_0)_{e,f} = \begin{cases} 1 & \text{if } f = e^{-1}, \\ 0 & \text{otherwise.} \end{cases} \]
B – J₀ は G の edge matrix と呼ばれます。
定理 2 (Hashimoto; Bass)
連結グラフ G について、
\[ \mathbf{Z}_G(u)^{-1} = \det(\mathbf{I}_{2m} – u(\mathbf{B} – \mathbf{J}_0)) = (1 – u^2)^{m-n} \det(\mathbf{I}_n – u\mathbf{A}(G) + u^2(\mathbf{D} – \mathbf{I}_n)) = \exp(-\sum_{k\geq1} \frac{N_k}{k} u^k), \]
ここで、m = |E(G)|, n = |V(G)|。また、N_k は G の長さ k の reduced cycles の個数を表します。
伊原のゼータ関数を使用したコミュニティ検出の実装
今回実装するグラフ G のゼータ関数 Z_G(u) は、以下の式にします:
ここで、各項目は以下を表します:
- |E(G)|: グラフ G の辺の数。
- |V(G)|: グラフ G の頂点の数。
- A(G): グラフ G の隣接行列 (Adjacency Matrix)。
- Q(G): 次数行列 (Degree Matrix) で、対角成分が d_i – 1 (頂点 i の次数から1を引いた値)です。
- I: 単位行列。
この一般形式は、グラフの構造を数学的に表現し、その特性を解析するためのツールとなります。特に、グラフの連結性、サイクル構造、スペクトル特性などの情報を含んでいます。
例えば、下の実装と結果から、行列式と、グラフの構造の特性としてのサイクルの数には相関が見られます。
# 行列式を計算する関数
def calculate_determinant(A, D, u):
    I = np.eye(A.shape[0])
    M = I - A * u + D * (u**2)
    det_M = np.linalg.det(M)
    return det_M

import random
import matplotlib.pyplot as pltimport networkx as nx

# グラフ描画関数
def draw_graph(A, title):
    G = nx.from_numpy_array(A)
    pos = nx.spring_layout(G)
    nx.draw(G, pos, with_labels=True, node_color='lightblue', edge_color='gray', node_size=3000, font_size=15)
    plt.title(title)
    plt.show()

# エッジをランダムに追加・削除して異なる構造のグラフを生成する関数
def generate_random_variation_of_graph(A, num_variations=2):
    G = nx.from_numpy_array(A)
    nodes = list(G.nodes())  # ノードのリストを取得
    for _ in range(num_variations):
        # ランダムにエッジを追加または削除
        if random.choice([True, False]):  # エッジの追加
            u, v = random.sample(nodes, 2)
            G.add_edge(u, v)
        else:  # エッジの削除
            if len(G.edges) > 0:
                u, v = random.choice(list(G.edges))
                G.remove_edge(u, v)
    # 新しい隣接行列を返す
    A_new = nx.to_numpy_array(G)
    D_new = np.diag(np.sum(A_new, axis=0).flatten())
    return np.array(A_new), D_new

# 無作為に選択してグラフを描画する関数
def draw_random_graph_samples(graph_generator, num_samples=5, num_variations=2):
    samples = []
    for _ in range(num_samples):
        A, D = graph_generator()
        A_varied, D_varied = generate_random_variation_of_graph(A, num_variations)
        samples.append((A_varied, D_varied))

    # サンプルの中から無作為に選択して描画
    for i, (A, D) in enumerate(random.sample(samples, min(len(samples), 3))):
        draw_graph(A, f"Sample {i+1} Graph")

    return samples

# 行列式とサイクル数を計算し相関を解析する関数
def analyze_determinant_cycle_correlation(samples):
    determinants = []
    cycle_counts = []

    for A, D in samples:
        det_value = calculate_determinant(A, D, u=1)
        determinants.append(det_value)

        G = nx.from_numpy_array(A)
        cycles = list(nx.cycle_basis(G))  # サイクルの基底を計算
        cycle_counts.append(len(cycles))

    # 相関を計算
    correlation = np.corrcoef(determinants, cycle_counts)[0, 1]

    plt.figure(figsize=(8, 6))
    plt.scatter(cycle_counts, determinants)
    plt.xlabel('Number of Cycles')
    plt.ylabel('Determinant')
    plt.title(f'Determinant vs. Number of Cycles (Correlation: {correlation:.2f})')
    plt.grid(True)
    plt.show()

    return correlation

# ラダ―グラフの隣接行列を生成
def get_ladder_graph_matrix(n=5):
    G = nx.ladder_graph(n)
    A = nx.to_numpy_array(G)
    D = np.diag(np.sum(A, axis=0).flatten())
    return np.array(A), D

# ホイールグラフの隣接行列を生成
def get_wheel_graph_matrix(n=6):
    G = nx.wheel_graph(n)
    A = nx.to_numpy_array(G)
    D = np.diag(np.sum(A, axis=0).flatten())
    return np.array(A), D

# ランダム連結グラフの隣接行列を生成
def get_random_connected_graph_matrix(n=6, p=0.5):
    while True:
        G = nx.erdos_renyi_graph(n, p)
        if nx.is_connected(G):
            break
    A = nx.to_numpy_array(G)
    D = np.diag(np.sum(A, axis=0).flatten())
    return np.array(A), D

# グラフサンプルを生成して描画し、行列式とサイクル数の相関を解析
ladder_samples = draw_random_graph_samples(get_ladder_graph_matrix, num_samples=1000, num_variations=3)
correlation_ladder = analyze_determinant_cycle_correlation(ladder_samples)

wheel_samples = draw_random_graph_samples(get_wheel_graph_matrix, num_samples=1000, num_variations=3)
correlation_wheel = analyze_determinant_cycle_correlation(wheel_samples)

random_connected_samples = draw_random_graph_samples(get_random_connected_graph_matrix, num_samples=1000, num_variations=3)
correlation_random_connected = analyze_determinant_cycle_correlation(random_connected_samples)

correlation_ladder, correlation_wheel, correlation_random_connected
3つの種類のグラフに対して結果を見てます。
順にラダ―グラフ、ホイールグラフ、そしててきとうに生成した連結グラフに対しての結果です。
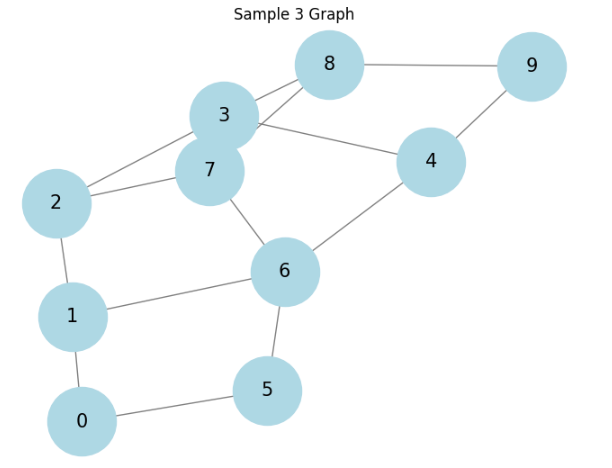
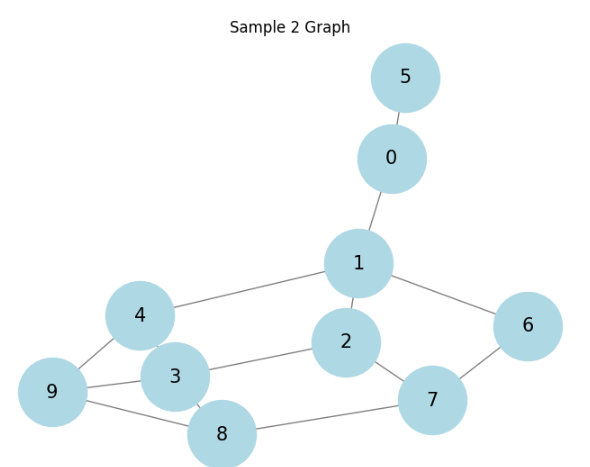
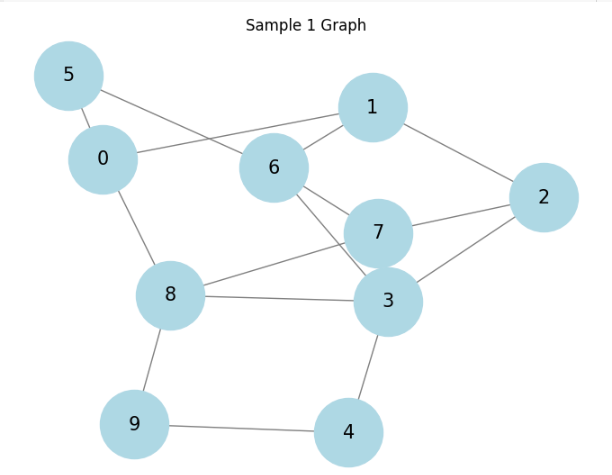
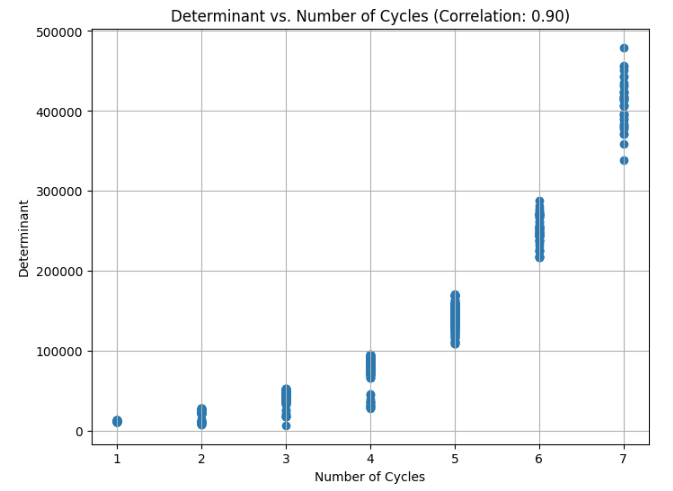
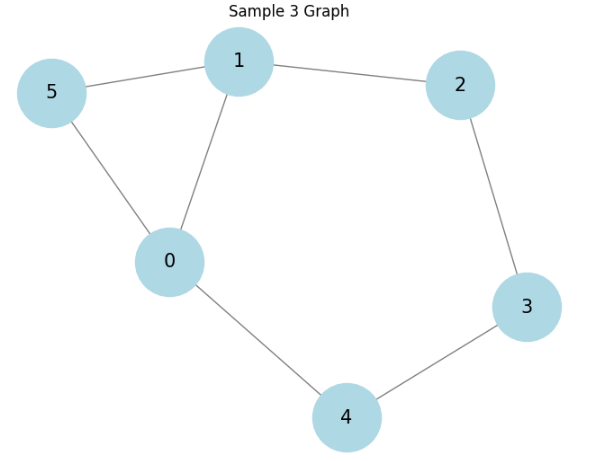
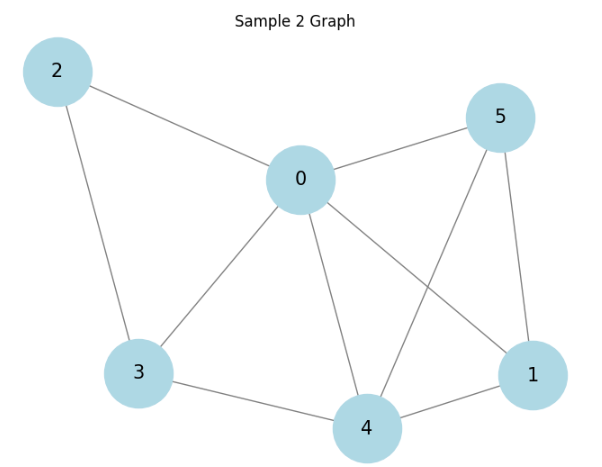
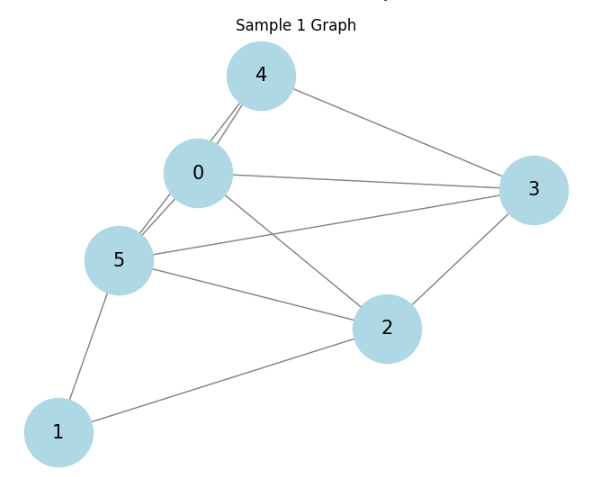
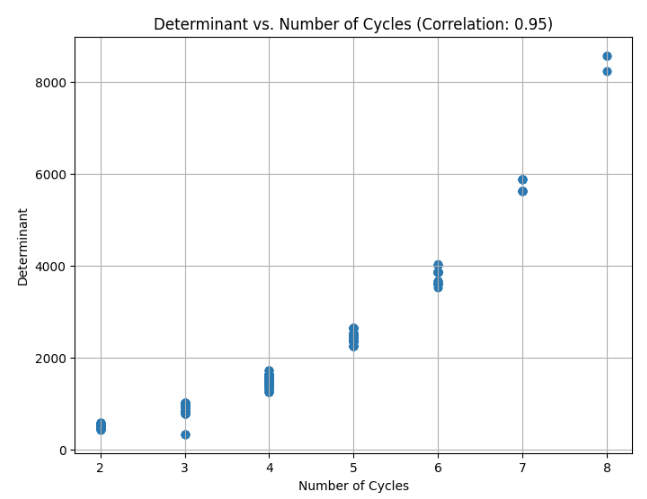
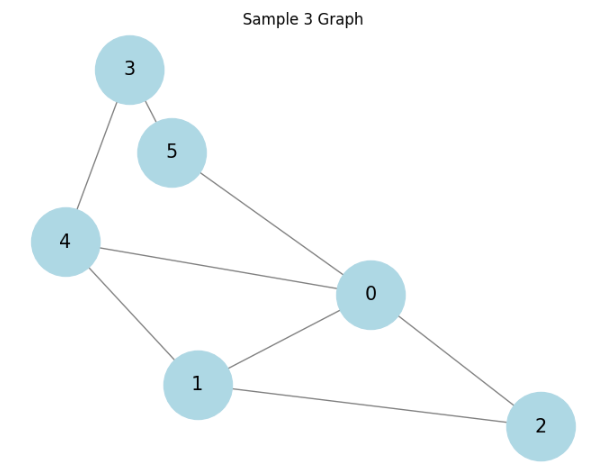
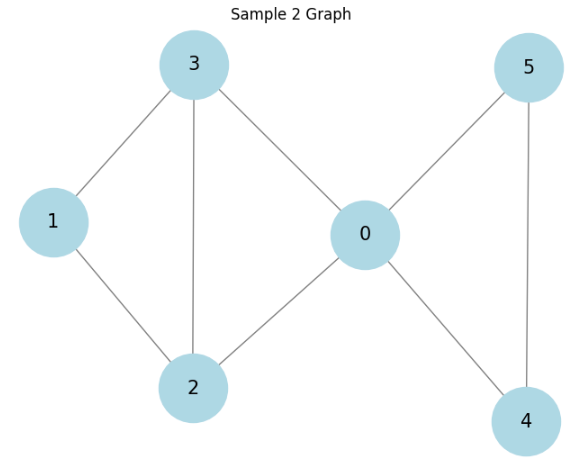
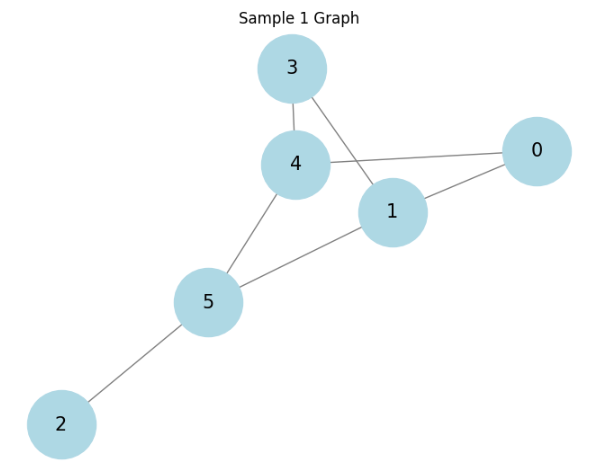
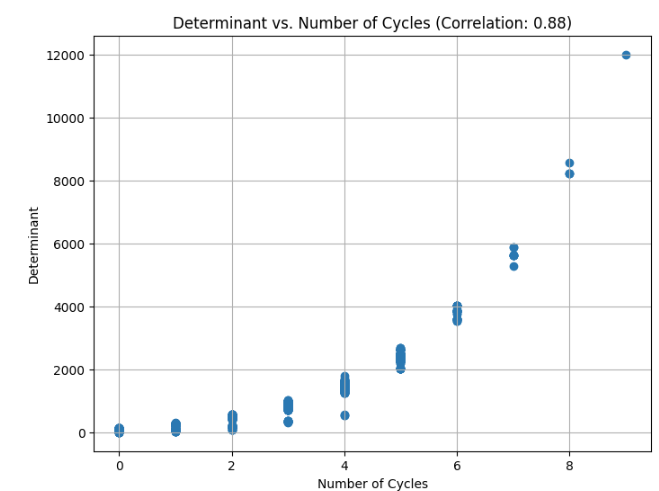
相関があると言えるかもしれません。もっと厳密に様々調べるべきですが、大体ありそうということで話を進めます。
伊原ゼータ関数の値は上記の数式の行列式によって大きく影響を受け、その行列式にはグラフのサイクルの構造の情報が反映されていそうだということでグラフのコミュティ検出を行うのですが、グラフゼータ関数は対象のグラフ全体の特徴を捉えることはできても、コミュニティ検出のようなグラフの局所的な特徴を特別に捉えて検出することは難しいので、ここで「サイクル密度」という概念を作ってコミュニティ検出を行いたいと思います。
実装は下のようにします。
# イハラゼータ関数の計算関数
def ihara_zeta(G, u):
    A = nx.adjacency_matrix(G).todense()  # 隣接行列
    D = np.diag([d - 1 for d in dict(G.degree()).values()])  # 次数行列
    I = np.eye(G.number_of_nodes())  # 単位行列

    det_matrix = I - A * u + D * (u**2)
    det_value = np.linalg.det(det_matrix)

    m = G.number_of_edges()
    n = G.number_of_nodes()

    zeta_value = ((1 - u**2)**(m - n)) / det_value
    return zeta_value

# 局所イハラゼータ関数に基づくサイクル密度の計算
def local_zeta_density(G, u=0.5, radius=2):
    local_zeta_scores = {}

    for node in G.nodes():
        subgraph_nodes = nx.single_source_shortest_path_length(G, node, cutoff=radius).keys()
        subgraph = G.subgraph(subgraph_nodes).copy()

        if subgraph.number_of_nodes() > 1:  # サブグラフが有意なサイズである場合
            zeta_value = ihara_zeta(subgraph, u)
            local_zeta_scores[node] = zeta_value
        else:
            local_zeta_scores[node] = 0  # 単一ノードはサイクルを持たないため0

    return local_zeta_scores
各node周辺のグラフを対象に伊原ゼータ関数を計算して、グラフのサイクルに関する情報を各nodeに割り当て、それをサイクル密度として定義します。
ここでパラメータはu, radius, でuは複素変数で通常はゼータ関数に関連するパラメータです。このコードでは、実数の値を取るようにしています。radiusはサブグラフの半径で、この半径内のノードを中心ノードからの距離に基づいて選択します。値が大きいほど、より多くのノードを含むサブグラフになります。
下のコードから出力の詳細を少し見ていきます。
for node in G.nodes():
    subgraph_nodes = nx.single_source_shortest_path_length(G, node, cutoff=radius).keys()
    print(subgraph_nodes)

visualize_graph(G, 'subgraph_nodes')
u_values = [0.1, 0.5, 0.9]
radius_values = [1, 2, 3]
threshold_values = [0.01, 0.05, 0.1]

for u, radius, threshold in product(u_values, radius_values, threshold_values):
    zeta_scores = local_zeta_density(G, u, radius)
    print(f"u: {u}, radius: {radius}, threshold: {threshold}")
    print(f"zeta_scores: {zeta_scores}")
    print(f"\n")
dict_keys([0, 1, 2, 4, 41, 50, 91, 3, 9, 12, 22, 25, 26, 62, 89, 5, 18, 28, 42, 68, 72, 85, 98, 6, 14, 38, 44, 52, 56, 63, 93, 82, 48, 8, 24, 13, 61, 17, 47, 19, 81, 31, 80, 96, 46, 16, 34, 64, 88, 32, 75, 54, 94, 49, 15, 20, 29, 60, 66, 69, 78, 79, 99, 57, 77, 43, 83, 84, 40, 7, 10, 27, 30, 51, 59, 76, 39, 45, 86, 87, 71, 90, 74, 65, 33, 37])
dict_keys([1, 0, 3, 9, 12, 22, 25, 26, 62, 89, 2, 4, 41, 50, 91, 16, 34, 64, 88, 32, 47, 8, 75, 54, 81, 13, 61, 17, 28, 56, 94, 14, 46, 49, 15, 19, 20, 29, 60, 66, 69, 78, 79, 99, 57, 77, 18, 31, 96, 93, 42, 48, 80, 5, 68, 72, 85, 98, 6, 38, 44, 52, 63, 82, 24, 35, 36, 55, 70, 95, 65, 7, 10, 74, 40, 39, 45, 86, 87, 53, 73, 33, 37])
dict_keys([2, 0, 5, 18, 28, 42, 68, 72, 85, 98, 1, 4, 41, 50, 91, 32, 43, 83, 84, 82, 47, 54, 81, 24, 25, 69, 80, 96, 93, 94, 14, 46, 40, 8, 75, 19, 13, 61, 3, 26, 31, 9, 12, 22, 62, 89, 6, 38, 44, 52, 56, 63, 48, 17, 16, 65, 10, 71, 90, 57, 77, 20, 39, 45, 86, 87, 7, 74, 34, 64, 88, 33, 37])
...

u: 0.1, radius: 1, threshold: 0.01
zeta_scores: {0: 0.9660249096067731, 1: 0.9385191435138718, 2: 0.8993249443407464, 3: 0.4073478149295536, 4: 0.9391503142463514, 5: 0.9731402225777394, 6: 0.9302018814904599, 7: 0.9342156935009913, 8: 0.35738424900764354, 9: 1.001192648129867, 10: 1.0015923805418048, 11: 1.0106720480353495, 12: 0.822424235391415, 13: 0.3289190791103606, 14: 0.3762651533732496, 15: 1.0005826274735294, 16: 0.9736257060550488, 17: 0.4874819425940276, 18: 0.41126793388586286, 19: 0.3865273828249569, 20: 1.000890617403453, 21: 1.0008075195187387, 22: 1.0108889801942664, 23: 1.0105955385820207, 24: 0.44078523640412526, 25: 0.4478020368387934, 26: 0.49568558368842314, 27: 1.010304945804048, 28: 0.49398852883573746, 29: 1.0109708768258046, 30: 1.010614923074269, 31: 0.5533742889888932, 32: 0.4903575304601943, 33: 1.0107995532152447, 34: 1.001404063500271, 35: 1.001237798973827, 36: 1.0104338240484838, 37: 1.0102377112606453, 38: 1.0102177485793136, 39: 1.0109261978658417, 40: 1.0105819652361077, 41: 0.5559855541509323, 42: 0.4486379930071322, 43: 1.0108269328411834, 44: 1.001114432006027, 45: 1.010384229018722, 46: 0.4189644055716971, 47: 0.5254261697254329, 48: 0.6059432442994644, 49: 1.0109557795843238, 50: 1.0110047875212473, 51: 1.0104098843680953, 52: 1.01036636717837, 53: 1.0102180523486382, 54: 0.44557780054145085, 55: 1.0106955072833124, 56: 0.6853220373071224, 57: 1.010213613172409, 58: 1.010432855535824, 59: 1.0104066632751398, 60: 1.010662766202181, 61: 0.3607704024609607, 62: 1.0102709716933416, 63: 1.010931440514051, 64: 1.0010050126027943, 65: 1.001729995007181, 66: 1.0012231294583822, 67: 1.0105433430922481, 68: 1.010943759459356, 69: 0.5171362702442052, 70: 1.011000904264084, 71: 1.0008544889673376, 72: 1.0103578779690234, 73: 1.0106996174705505, 74: 1.0102127775949583, 75: 0.47340869032933885, 76: 1.0106546667769734, 77: 1.0102026447736507, 78: 1.0105270830391824, 79: 1.0106884823741447, 80: 0.5881793466499037, 81: 0.3588525395435427, 82: 0.4541077663600647, 83: 1.0104960412414847, 84: 1.0104693015614523, 85: 1.0104838505400726, 86: 1.010282398213067, 87: 1.0103160507540478, 88: 1.010726131539873, 89: 1.0103964151196079, 90: 1.0109721422313291, 91: 0.40019820138707546, 92: 1.0107556183353397, 93: 0.3883962717963196, 94: 0.3825134392684916, 95: 1.0106525841203584, 96: 0.38687234300635664, 97: 1.010267974751646, 98: 1.010564900604793, 99: 1.010304759345143}


u: 0.1, radius: 1, threshold: 0.05
zeta_scores: {0: 0.9660249096067731, 1: 0.9385191435138718, 2: 0.8993249443407464, 3: 0.4073478149295536, 4: 0.9391503142463514, 5: 0.9731402225777394, 6: 0.9302018814904599, 7: 0.9342156935009913, 8: 0.35738424900764354, 9: 1.001192648129867, 10: 1.0015923805418048, 11: 1.0106720480353495, 12: 0.822424235391415, 13: 0.3289190791103606, 14: 0.3762651533732496, 15: 1.0005826274735294, 16: 0.9736257060550488, 17: 0.4874819425940276, 18: 0.41126793388586286, 19: 0.3865273828249569, 20: 1.000890617403453, 21: 1.0008075195187387, 22: 1.0108889801942664, 23: 1.0105955385820207, 24: 0.44078523640412526, 25: 0.4478020368387934, 26: 0.49568558368842314, 27: 1.010304945804048, 28: 0.49398852883573746, 29: 1.0109708768258046, 30: 1.010614923074269, 31: 0.5533742889888932, 32: 0.4903575304601943, 33: 1.0107995532152447, 34: 1.001404063500271, 35: 1.001237798973827, 36: 1.0104338240484838, 37: 1.0102377112606453, 38: 1.0102177485793136, 39: 1.0109261978658417, 40: 1.0105819652361077, 41: 0.5559855541509323, 42: 0.4486379930071322, 43: 1.0108269328411834, 44: 1.001114432006027, 45: 1.010384229018722, 46: 0.4189644055716971, 47: 0.5254261697254329, 48: 0.6059432442994644, 49: 1.0109557795843238, 50: 1.0110047875212473, 51: 1.0104098843680953, 52: 1.01036636717837, 53: 1.0102180523486382, 54: 0.44557780054145085, 55: 1.0106955072833124, 56: 0.6853220373071224, 57: 1.010213613172409, 58: 1.010432855535824, 59: 1.0104066632751398, 60: 1.010662766202181, 61: 0.3607704024609607, 62: 1.0102709716933416, 63: 1.010931440514051, 64: 1.0010050126027943, 65: 1.001729995007181, 66: 1.0012231294583822, 67: 1.0105433430922481, 68: 1.010943759459356, 69: 0.5171362702442052, 70: 1.011000904264084, 71: 1.0008544889673376, 72: 1.0103578779690234, 73: 1.0106996174705505, 74: 1.0102127775949583, 75: 0.47340869032933885, 76: 1.0106546667769734, 77: 1.0102026447736507, 78: 1.0105270830391824, 79: 1.0106884823741447, 80: 0.5881793466499037, 81: 0.3588525395435427, 82: 0.4541077663600647, 83: 1.0104960412414847, 84: 1.0104693015614523, 85: 1.0104838505400726, 86: 1.010282398213067, 87: 1.0103160507540478, 88: 1.010726131539873, 89: 1.0103964151196079, 90: 1.0109721422313291, 91: 0.40019820138707546, 92: 1.0107556183353397, 93: 0.3883962717963196, 94: 0.3825134392684916, 95: 1.0106525841203584, 96: 0.38687234300635664, 97: 1.010267974751646, 98: 1.010564900604793, 99: 1.010304759345143}


u: 0.1, radius: 1, threshold: 0.1
zeta_scores: {0: 0.9660249096067731, 1: 0.9385191435138718, 2: 0.8993249443407464, 3: 0.4073478149295536, 4: 0.9391503142463514, 5: 0.9731402225777394, 6: 0.9302018814904599, 7: 0.9342156935009913, 8: 0.35738424900764354, 9: 1.001192648129867, 10: 1.0015923805418048, 11: 1.0106720480353495, 12: 0.822424235391415, 13: 0.3289190791103606, 14: 0.3762651533732496, 15: 1.0005826274735294, 16: 0.9736257060550488, 17: 0.4874819425940276, 18: 0.41126793388586286, 19: 0.3865273828249569, 20: 1.000890617403453, 21: 1.0008075195187387, 22: 1.0108889801942664, 23: 1.0105955385820207, 24: 0.44078523640412526, 25: 0.4478020368387934, 26: 0.49568558368842314, 27: 1.010304945804048, 28: 0.49398852883573746, 29: 1.0109708768258046, 30: 1.010614923074269, 31: 0.5533742889888932, 32: 0.4903575304601943, 33: 1.0107995532152447, 34: 1.001404063500271, 35: 1.001237798973827, 36: 1.0104338240484838, 37: 1.0102377112606453, 38: 1.0102177485793136, 39: 1.0109261978658417, 40: 1.0105819652361077, 41: 0.5559855541509323, 42: 0.4486379930071322, 43: 1.0108269328411834, 44: 1.001114432006027, 45: 1.010384229018722, 46: 0.4189644055716971, 47: 0.5254261697254329, 48: 0.6059432442994644, 49: 1.0109557795843238, 50: 1.0110047875212473, 51: 1.0104098843680953, 52: 1.01036636717837, 53: 1.0102180523486382, 54: 0.44557780054145085, 55: 1.0106955072833124, 56: 0.6853220373071224, 57: 1.010213613172409, 58: 1.010432855535824, 59: 1.0104066632751398, 60: 1.010662766202181, 61: 0.3607704024609607, 62: 1.0102709716933416, 63: 1.010931440514051, 64: 1.0010050126027943, 65: 1.001729995007181, 66: 1.0012231294583822, 67: 1.0105433430922481, 68: 1.010943759459356, 69: 0.5171362702442052, 70: 1.011000904264084, 71: 1.0008544889673376, 72: 1.0103578779690234, 73: 1.0106996174705505, 74: 1.0102127775949583, 75: 0.47340869032933885, 76: 1.0106546667769734, 77: 1.0102026447736507, 78: 1.0105270830391824, 79: 1.0106884823741447, 80: 0.5881793466499037, 81: 0.3588525395435427, 82: 0.4541077663600647, 83: 1.0104960412414847, 84: 1.0104693015614523, 85: 1.0104838505400726, 86: 1.010282398213067, 87: 1.0103160507540478, 88: 1.010726131539873, 89: 1.0103964151196079, 90: 1.0109721422313291, 91: 0.40019820138707546, 92: 1.0107556183353397, 93: 0.3883962717963196, 94: 0.3825134392684916, 95: 1.0106525841203584, 96: 0.38687234300635664, 97: 1.010267974751646, 98: 1.010564900604793, 99: 1.010304759345143}

...
グラフゼータ関数によるコミュニティ検出の実装
このように、各ノードに対してサブグラフのグラフゼータ関数の値からサイクル密度を付与します。パラメータの探索を行い、最適なコミュニティ検出を行います。
最適化には、上記で説明したモジュラリティ(modularity)を使用します。
# コミュニティ検出と最適化
def detect_and_optimize_communities(G):
    best_modularity = -1
    best_partitions = None
    best_params = None

    u_values = [0.1, 0.5, 0.9]
    radius_values = [1, 2, 3]
    threshold_values = [0.01, 0.05, 0.1]

    for u, radius, threshold in product(u_values, radius_values, threshold_values):
        zeta_scores = local_zeta_density(G, u, radius)

        partitions = {}
        for node, score in zeta_scores.items():
            if score > threshold:
                partitions[node] = 1
            else:
                partitions[node] = 0

        communities = set(partitions.values())
        if len(communities) > 1:
            modularity = nx.algorithms.community.quality.modularity(
                G, [set(n for n in partitions if partitions[n] == c) for c in communities])
        else:
            modularity = 0

        if modularity > best_modularity:
            best_modularity = modularity
            best_partitions = partitions
            best_params = (u, radius, threshold)

    print(f"Best Parameters: u={best_params[0]}, radius={best_params[1]}, threshold={best_params[2]}")
    print(f"Best Modularity: {best_modularity}")

    return best_partitions, best_params

best_partitions, best_params = detect_and_optimize_communities(G)
visualize_community_graphs(G, [best_partitions], ["Best Community Partition"])
結果
結果は以下の通りです:
Best Parameters: u=0.5, radius=1, threshold=0.01
Best Modularity: 0.09151042412604862
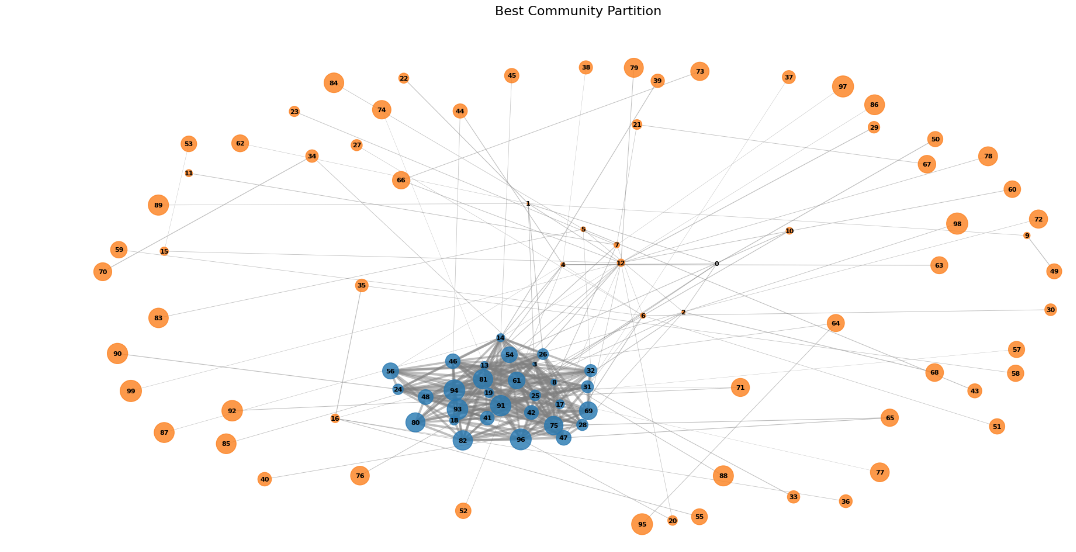
結果を見ると、うまく区別できているようです。ただし、グラフ内に中心的なコミュニティが2つ以上存在する場合は、さらなる工夫が必要かもしれません。
グラフであそぶ
最後に、グラフをインタラクティブに可視化するコードを紹介します。
partitionやedgesのweightなどのパラメータを変化させて、各自のネットワーク解析に合わせて調整してみてください。
import json
import os
import webbrowser
import numpy as np

class NumpyEncoder(json.JSONEncoder):
    def default(self, obj):
        if isinstance(obj, np.integer):
            return int(obj)
        elif isinstance(obj, np.floating):
            return float(obj)
        elif isinstance(obj, np.ndarray):
            return obj.tolist()
        return super(NumpyEncoder, self).default(obj)

def create_interactive_visualization(G, partition, title):
    partition_nodes = [node for node, community in partition.items() if community == 1]

    # Calculate the maximum weight for color scaling
    max_weight = max(d["weight"] for u, v, d in G.edges(data=True))

    nodes = [{"id": node, "group": partition[node], "inPartition": node in partition_nodes} for node in G.nodes()]
    links = [{"source": u, "target": v, "value": d["weight"], "normalizedWeight": d["weight"] / max_weight,
              "count_percent": d.get("count_percent", 0),
              "sync_count": d.get("sync_count", 0),
              "ID1_count": d.get("ID1_count", 0),
              "ID2_count": d.get("ID2_count", 0),
              "all_count": d.get("all_count", 0),
              "sync_bdate_count": d.get("sync_bdate_count", 0)} for u, v, d in G.edges(data=True)]

    graph_data = {"nodes": nodes, "links": links}

    html_template = """

    <!DOCTYPE html>
    <html lang="en">
    <head>
        <meta charset="UTF-8">
        <meta name="viewport" content="width=device-width, initial-scale=1.0">
        <title>{title}</title>
        <script src="https://cdnjs.cloudflare.com/ajax/libs/d3/7.8.5/d3.min.js"></script>
        <style>
            body {{
                font-family: Arial, sans-serif;
                margin: 0;
                padding: 0;
                display: flex;
                height: 100vh;
                overflow: hidden;
            }}
            #graph-container {{
                flex: 1;
                overflow: hidden;
            }}
            #graph {{
                width: 100%;
                height: 100%;
            }}
            #sidebar {{
                width: 500px;
                padding: 20px;
                background-color: #f0f0f0;
                overflow-y: auto;
                height: 100vh;
                box-sizing: border-box;
            }}
            #node-list, #connected-nodes-list {{
                list-style-type: none;
                padding: 0;
                margin: 0;
            }}
            #node-list li, #connected-nodes-list li {{
                font-size: 14px;
                margin-bottom: 5px;
                word-break: break-all;
                cursor: pointer;
            }}
            .highlighted {{
                color: red;
            }}
            #color-picker {{
                margin-top: 20px;
            }}
            #connected-nodes-info {{
                margin-top: 20px;
            }}
            .node-pair-info {{
                margin-left: 20px;
                font-size: 14px;
            }}
            #weight-threshold-control {{
                margin-top: 20px;
            }}
            #weight-threshold-value {{
                margin-left: 10px;
            }}
        </style>
    </head>
    <body>
        <div id="graph-container">
            <div id="graph"></div>
        </div>
        <div id="sidebar">
            <h2>Partition Node IDs</h2>
            <ul id="node-list"></ul>
            <div id="weight-threshold-control">
                <label for="weight-threshold">Weight Threshold: </label>
                <input type="range" id="weight-threshold" min="0" max="100" value="35" step="1">
                <span id="weight-threshold-value">35</span>
            </div>
            <div id="connected-nodes-info">
                <h3>Connected Nodes</h3>
                <ul id="connected-nodes-list"></ul>
            </div>
        </div>

        <script>
        const graphData = {graph_json};

        const width = window.innerWidth - 500;
        const height = window.innerHeight;

        const color = d3.scaleLinear()
            .domain([0, 1])
            .range(["#f0f0f0", "#000080"]);

        const partitionColor = d3.scaleLinear()
            .domain([0, 1])
            .range(["#90EE90", "#006400"]);

        const simulation = d3.forceSimulation(graphData.nodes)
            .force("link", d3.forceLink(graphData.links).id(d => d.id))
            .force("charge", d3.forceManyBody().strength(d => d.inPartition ? -500 : -30))
            .force("center", d3.forceCenter(width / 2, height / 2))
            .force("x", d3.forceX(width / 2).strength(0.1))
            .force("y", d3.forceY(height / 2).strength(0.1));

        const svg = d3.select("#graph")
            .append("svg")
            .attr("viewBox", [0, 0, width, height])
            .call(d3.zoom().scaleExtent([0.1, 4]).on("zoom", zoomed));


        const g = svg.append("g");

        graphData.links.sort((a, b) => b.weight - a.weight);

        const link = g.append("g")
            .selectAll("line")
            .data(graphData.links)
            .join("line")
            .attr("stroke", d => color(d.normalizedWeight))
            .attr("stroke-opacity", 0.6)
            .attr("stroke-width", d => d.normalizedWeight * 3 + 0.5)
            .attr("data-weight", d => d.weight)
            .lower();

        const node = g.append("g")
            .selectAll("circle")
            .data(graphData.nodes)
            .join("circle")
            .attr("r", d => d.inPartition ? 8 : 3)
            .attr("fill", d => d.inPartition ? "green" : "blue")
            .call(drag(simulation))
            .on("click", clicked);

        let weightThreshold = 35;
        let selectedNode = null;

        function updateWeightThreshold(value) {{
            weightThreshold = value;
            document.getElementById('weight-threshold-value').textContent = value;
            updateVisualization();
        }}

        function updateVisualization() {{
            link.attr("stroke", d => d.value >= weightThreshold ? "red" : color(d.normalizedWeight))
                .attr("stroke-width", d => d.value >= weightThreshold ? 2 : d.normalizedWeight * 3 + 0.5);

            d3.selectAll("#node-list li")
                .style("color", function(d) {{
                    const connectedLink = graphData.links.find(l =>
                        (l.source.id === d.id && l.target.id === selectedNode.id) ||
                        (l.source.id === selectedNode.id && l.target.id === d.id)
                    );
                    return connectedLink && connectedLink.value >= weightThreshold ? "red" : "black";
                }});

            if (selectedNode) {{
                updateConnectedNodesList(selectedNode);
            }}
        }}

        const weightThresholdSlider = document.getElementById('weight-threshold');
        weightThresholdSlider.addEventListener('input', function() {{
            updateWeightThreshold(this.value);
        }});

        function reorderEdges() {{
            g.selectAll("line")
                .sort((a, b) => a.weight - b.weight)
                .each(function() {{
                    this.parentNode.appendChild(this);
                }});
        }}

        node.append("title")
            .text(d => d.id);

        simulation.on("tick", () => {{
            link
                .attr("x1", d => d.source.x)
                .attr("y1", d => d.source.y)
                .attr("x2", d => d.target.x)
                .attr("y2", d => d.target.y);

            node
                .attr("cx", d => d.x)
                .attr("cy", d => d.y);

            reorderEdges();
        }});

        function zoomed(event) {{
            g.attr("transform", event.transform);
        }}

        function drag(simulation) {{
            function dragstarted(event) {{
                if (!event.active) simulation.alphaTarget(0.3).restart();
                event.subject.fx = event.subject.x;
                event.subject.fy = event.subject.y;
            }}

            function dragged(event) {{
                event.subject.fx = event.x;
                event.subject.fy = event.y;
            }}

            function dragended(event) {{
                if (!event.active) simulation.alphaTarget(0);
                event.subject.fx = null;
                event.subject.fy = null;
            }}

            return d3.drag()
                .on("start", dragstarted)
                .on("drag", dragged)
                .on("end", dragended);
        }}

        function clicked(event, d) {{
            event.stopPropagation();
            selectedNode = d;
            highlightConnectedNodes(d);
            updateConnectedNodesList(d);
            centerNode(d);
            attractConnectedNodes(d);
            highlightSelectedNodeInList(d);
        }}

        function highlightSelectedNodeInList(d) {{
            d3.selectAll("#node-list li")
                .style("font-weight", function(n) {{
                    return n.id === d.id ? "bold" : "normal";
                }});
        }}

        function highlightConnectedNodes(d) {{
            const connectedLinks = graphData.links.filter(l => l.source.id === d.id || l.target.id === d.id);
            const maxWeight = Math.max(...connectedLinks.map(l => l.value));

            const connectedNodeIds = new Set();
            connectedLinks.forEach(l => {{
                connectedNodeIds.add(l.source.id);
                connectedNodeIds.add(l.target.id);
            }});

            node.attr("fill", n => {{
                if (n.id === d.id) return "red";
                if (connectedNodeIds.has(n.id)) {{
                    const connectedLink = connectedLinks.find(l => (l.source.id === n.id && l.target.id === d.id) || (l.source.id === d.id && l.target.id === n.id));
                    return connectedLink.value >= weightThreshold ? "red" : (n.inPartition ? "orange" : "lightgreen");
                }}
                return n.inPartition ? "blue" : "blue";
            }});

            link.attr("stroke", l => {{
                if (l.source.id === d.id || l.target.id === d.id) {{
                    return l.value >= weightThreshold ? "red" : (l.source.inPartition || l.target.inPartition ? "#86bf00" : "green");
                }}
                return color(l.normalizedWeight);
            }})
            .attr("stroke-width", l => (l.source.id === d.id || l.target.id === d.id) ? 2 : l.normalizedWeight * 3 + 0.5);

            d3.selectAll("#node-list li")
                .style("color", n => {{
                    if (n.id === d.id) return "red";
                    if (connectedNodeIds.has(n.id)) {{
                        const connectedLink = connectedLinks.find(l => (l.source.id === n.id && l.target.id === d.id) || (l.source.id === d.id && l.target.id === n.id));
                        return connectedLink.value >= weightThreshold ? "red" : (n.inPartition ? "#86bf00" : "green");
                    }}
                    return "black";
                }});
        }}

        function updateConnectedNodesList(d) {{
            const connectedNodes = graphData.links
                .filter(l => l.source.id === d.id || l.target.id === d.id)
                .map(l => {{
                    const connectedNode = l.source.id === d.id ? l.target : l.source;
                    return {{
                        id: connectedNode.id,
                        weight: l.value,
                        inPartition: connectedNode.inPartition,
                        count_percent: l.count_percent,
                        sync_count: l.sync_count,
                        ID1_count: l.ID1_count,
                        ID2_count: l.ID2_count,
                        all_count: l.all_count
                    }};
                }})
                .sort((a, b) => b.weight - a.weight);

            const connectedNodesList = d3.select("#connected-nodes-list");
            connectedNodesList.selectAll("*").remove();

            connectedNodesList.selectAll("li")
                .data(connectedNodes)
                .enter()
                .append("li")
                .html(d => `
                    <strong style="color: ${{d.weight >= weightThreshold ? 'red' : 'black'}}">ID: ${{d.id}}</strong><br>
                    <span style="color: ${{d.weight >= weightThreshold ? 'red' : 'black'}}">Weight: ${{d.weight.toFixed(2)}}</span><br>
                    ${{d.inPartition ? "Partition" : "Non-Partition"}}<br>
                    <div class="node-pair-info">
                        count_percent: ${{d.count_percent.toFixed(2)}}<br>
                        sync_count: ${{d.sync_count}}<br>
                        ID1_count: ${{d.ID1_count}}<br>
                        ID2_count: ${{d.ID2_count}}<br>
                        all_count: ${{d.all_count}}
                    </div>
                `);
        }}

        let transform = d3.zoomIdentity;

        const zoom = d3.zoom()
            .scaleExtent([0.1, 4])
            .on("zoom", function(event) {{
                transform = event.transform;
                g.attr("transform", transform);
            }});

        svg.call(zoom);

        function centerNode(d) {{
            const scale = Math.min(2, 0.9 / Math.max(d.x / width, d.y / height));
            const x = width / 2 - scale * d.x;
            const y = height / 2 - scale * d.y;

            svg.transition()
                .duration(750)
                .call(
                    zoom.transform,
                    d3.zoomIdentity.translate(x, y).scale(scale)
                );
        }}

        function attractConnectedNodes(d) {{
            const connectedNodes = graphData.links
                .filter(l => l.source.id === d.id || l.target.id === d.id)
                .map(l => {{
                    const connectedNode = l.source.id === d.id ? l.target : l.source;
                    return {{
                        node: connectedNode,
                        weight: l.value
                    }};
                }});

            const maxWeight = Math.max(...connectedNodes.map(n => n.weight));

            simulation.force("attract", d3.forceRadial(100, d.x, d.y)
                .strength(n => {{
                    const connectedNode = connectedNodes.find(cn => cn.node === n);
                    return connectedNode ? (connectedNode.weight / maxWeight) * 0.1 : 0;
                }}));

            simulation.alpha(0.3).restart();
        }}

        window.addEventListener('resize', () => {{
            const newWidth = window.innerWidth - 500;
            const newHeight = window.innerHeight;
            svg.attr("viewBox", [0, 0, newWidth, newHeight]);
            simulation.force("center", d3.forceCenter(newWidth / 2, newHeight / 2));
            simulation.alpha(0.3).restart();
        }});

        // グラフの外側をクリックした時にズームをリセット
        svg.on("click", function(event) {{
            if (event.target.tagName === "svg") {{
                svg.transition().duration(750).call(
                    zoom.transform,
                    d3.zoomIdentity,
                    d3.zoomTransform(svg.node()).invert([width / 2, height / 2])
                );
            }}
        }});

        const nodeList = d3.select("#node-list")
            .selectAll("li")
            .data(graphData.nodes.filter(d => d.inPartition))
            .enter()
            .append("li")
            .text(d => d.id)
            .style("cursor", "pointer")
            .on("click", function(event, d) {{
                clicked(event, d);
                centerNode(d);
            }});

        node.on("click", clicked);

        // ウィンドウのリサイズ時にSVGのサイズを調整
        window.addEventListener('resize', () => {{
            const newWidth = window.innerWidth - 500;
            const newHeight = window.innerHeight;
            svg.attr("viewBox", [0, 0, newWidth, newHeight]);
            simulation.force("center", d3.forceCenter(newWidth / 2, newHeight / 2));
            simulation.alpha(1).restart();
        }});

    </script>
    </body>
    </html>
    """

    file_name = f"{title.replace(' ', '_')}.html"
    with open(file_name, "w") as f:
        f.write(html_template.format(title=title, graph_json=json.dumps(graph_data, cls=NumpyEncoder)))


ids_partition = best_partitions
partition = {_id: 1 if _id in ids_partition else 0 for _id in set(G.nodes())}
create_interactive_visualization(G, partition, "interactive_graph_visualization")
ids_partition = [key for key, val in partition.items() if val == 1]
print(ids_partition)
print(f"length of ids: {len(ids_partition)}")
インタラクティブなグラフの可視化をぜひ試してみてください。
最後に
今回は、連結グラフに対する伊原型行列式表示を使用し、グラフ上の中心的なコミュニティを検出しました。今後は、複数の中心的なコミュニティを検出できる実装に挑戦したいと考えています。
当社のAI研究開発室では、データサイエンティストや機械学習エンジニアを募集しています。ご興味のある方は、募集職種一覧からぜひご応募ください。
グループ研究開発本部の最新情報をTwitterで配信中です。ぜひフォローください。
Follow @GMO_RD


