2024.10.02
regimeベースの投資戦略をchatGPTに実装させてみた
はじめに
グループ研究開発本部・AI研究開発室のS.Sです。
今回もChatGPTにやらせてみたという前回記事の続きで、CPIベースでレジームを判断させてそれに応じていずれかの金属(金・銀・銅)を取引するような投資戦略を実装してみたいと思います。
レジームの定義
今回はレジームを定義するための指標としてUS CPIを利用します。
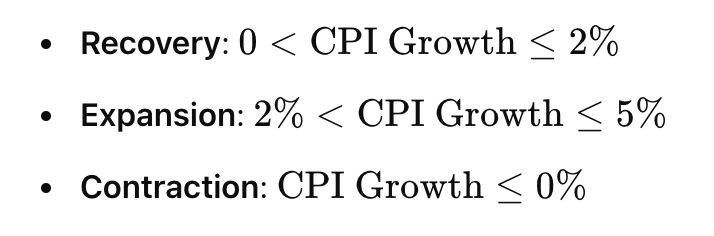
CPIの変化率によって次の3段階に分けて考えることにします。
- 回復: 経済が収縮から回復しつつあり、インフレーションは増加していますが、まだ中程度または低い水準です。インフレーションは、以前の低いまたはマイナスのレベルから上昇しています
- 拡張: 経済が安定的に成長しており、インフレーションは中程度で安定しています。CPI の成長率はプラスであり、健全な目標範囲内です。
- 収縮: 経済が減速または縮小しており、インフレーションの低下またはデフレーションを示すことが多いです。CPI の成長率はマイナスまたは非常に低くなります。
取引戦略の実装
まずはシンプルにレジームに基づいたいずれかの金属(金・銀・銅)をlongする戦略を実装してくれるようにお願いしてみます。
すると次のような回答が帰ってきます。
CPI に基づいたレジーム(回復、拡張、収縮)に基づいて、金、銀、銅の最適な取引戦略を作成するための目標は、各レジームにおいてこれらの資産のうち1つを選択し、ロングポジションを取ることでリターンを最大化する取引ルールを定義することです。
戦略開発のステップ:
- レジーム分析: CPI の成長率を使用して金融レジームを定義する。
- 資産パフォーマンス: 各体制における金、銀、銅の過去のパフォーマンスを分析する。
- 最適な配分: 各体制において、最適なリターンを目指して3つの資産のうち1つに配分する取引ルールを作成する。
詳細コードは省略しますが、このケースだと各レジームでのパフォーマンスを測定し、それに基づいてベストな資産を選ぶというやり方を提示してきます。
過去の各レジームにおいてどの資産のパフォーマンスがよいかはある程度知られており、今回は完全なデータドリブンではなく常識的な判断に基づいて戦略を作ってもらうようにお願いしてみます。
金、銀、銅の中から、金融レジーム(回復、拡張、収縮)に基づいて最もパフォーマンスが良い資産を選択するために、常識に基づいて次のアプローチを取ることができます。
仮定:
- 回復期: 経済が回復し、産業需要が増加するため、銅が優れたパフォーマンスを発揮する傾向があります。
- 拡張期: 銀または銅が優れる可能性があり、産業需要(銅)や投機的需要(銀)が増加します。
- 収縮期: 金は安全資産としての地位から、通常は最も優れたパフォーマンスを発揮します。
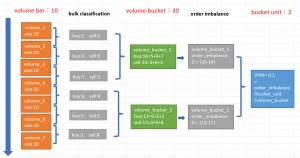
生成されたコードは以下のようなもので、レジームごとに取引する資産を切り替えるものとなっています。
import pandas as pd
import matplotlib.pyplot as plt

# Step 1: Load historical data
# Assuming `cpi_data`, `gold_data`, `silver_data`, and `copper_data` are pandas DataFrames
# with 'Date' as the index and daily prices for each instrument.

# Calculate CPI growth rate (12-month rolling window for year-over-year change)
cpi_data['CPI_Growth'] = cpi_data['CPI'].pct_change(periods=12) * 100

# Step 2: Define financial regimes based on CPI growth
def classify_regime(cpi_growth):
    if cpi_growth > 5:
        return 'Expansion'
    elif 0 < cpi_growth <= 2:
        return 'Recovery'
    elif cpi_growth <= 0:
        return 'Contraction'
    else:
        return 'Expansion'

cpi_data['Regime'] = cpi_data['CPI_Growth'].apply(classify_regime)

# Step 3: Calculate daily returns for gold, silver, and copper
gold_data['Gold_Return'] = gold_data['Gold_Price'].pct_change() * 100
silver_data['Silver_Return'] = silver_data['Silver_Price'].pct_change() * 100
copper_data['Copper_Return'] = copper_data['Copper_Price'].pct_change() * 100

# Step 4: Merge data into a single DataFrame
data = cpi_data[['Regime']].copy()
data = data.join(gold_data['Gold_Return'], how='inner')
data = data.join(silver_data['Silver_Return'], how='inner')
data = data.join(copper_data['Copper_Return'], how='inner')

# Step 5: Create common-sense trading rules
def choose_best_asset(row):
    if row['Regime'] == 'Recovery':
        return 'Silver'  # Silver typically performs well during recovery.
    elif row['Regime'] == 'Expansion':
        return 'Copper'  # Copper benefits from expansion and industrial growth.
    elif row['Regime'] == 'Contraction':
        return 'Gold'  # Gold is a safe haven during contractionary periods.

# Step 6: Apply the strategy
data['Chosen_Asset'] = data.apply(choose_best_asset, axis=1)

# Step 7: Simulate the strategy's performance
initial_capital = 1000
data['Portfolio_Value'] = initial_capital

# Loop through the data, updating portfolio value based on the chosen asset's return
for i in range(1, len(data)):
    prev_value = data['Portfolio_Value'].iloc[i-1]
    if data['Chosen_Asset'].iloc[i] == 'Gold':
        data['Portfolio_Value'].iloc[i] = prev_value * (1 + data['Gold_Return'].iloc[i] / 100)
    elif data['Chosen_Asset'].iloc[i] == 'Silver':
        data['Portfolio_Value'].iloc[i] = prev_value * (1 + data['Silver_Return'].iloc[i] / 100)
    elif data['Chosen_Asset'].iloc[i] == 'Copper':
        data['Portfolio_Value'].iloc[i] = prev_value * (1 + data['Copper_Return'].iloc[i] / 100)

# Step 8: Plot the portfolio value over time
data['Portfolio_Value'].plot(title='Portfolio Value Over Time', figsize=(10, 6))
plt.xlabel('Date')
plt.ylabel('Portfolio Value')
plt.show()

# Step 9: Performance summary
final_value = data['Portfolio_Value'].iloc[-1]
total_return = (final_value - initial_capital) / initial_capital * 100
print(f"Final Portfolio Value: ${final_value:.2f}")
print(f"Total Return: {total_return:.2f}%")
ついでに必要なデータをyfinanceで取得するコードも生成してもらいます。
import yfinance as yf
import pandas as pd

# Define ticker symbols for gold, silver, and copper on Yahoo Finance
tickers = {
    'Gold': 'GC=F',      # Gold futures
    'Silver': 'SI=F',    # Silver futures
    'Copper': 'HG=F'     # Copper futures
}

# Define the date range for fetching the data
start_date = '2020-01-01'
end_date = '2024-01-01'

# Fetch data for each commodity
data = {}
for metal, ticker in tickers.items():
    print(f"Fetching data for {metal}...")
    data[metal] = yf.download(ticker, start=start_date, end=end_date)

# Store the data in a combined DataFrame
combined_data = pd.DataFrame({
    'Gold_Price': data['Gold']['Adj Close'],
    'Silver_Price': data['Silver']['Adj Close'],
    'Copper_Price': data['Copper']['Adj Close']
})

# Display the first few rows of the combined data
print(combined_data.head())

# Save to CSV (optional)
combined_data.to_csv('commodities_prices.csv')

# Plot the data
combined_data.plot(title='Gold, Silver, and Copper Prices', figsize=(10, 6))
上記を組み合わせた検証用コードの作成
上記でChatGPTが生成してくれたコードはもう少しで動きそうなので、あとは手でグルーコードを書き加えると以下のようになります。
当月のCPIが公開されるのは翌月の15日前後となりますが、下記のコードでは当月のCPIが当月の時点でわかるという前提で実装しています。インフレ期待値やその他の指標を参考にすることでおおまかに推測することはできるでしょう。
import pandas as pd
import numpy as np
import yfinance as yf
import matplotlib.pyplot as plt


df_cpi = pd.read_csv("CPIAUCSL.csv")
df_cpi["DATE"] = df_cpi["DATE"].pipe(pd.to_datetime)
df_cpi = df_cpi.set_index(["DATE"]).squeeze()


tickers = {
    'Gold': 'GC=F',      # Gold futures
    'Silver': 'SI=F',    # Silver futures
    'Copper': 'HG=F'     # Copper futures
}

# Define the date range for fetching the data
start_date = '2000-01-01'
end_date = '2024-01-01'

# Fetch data for each commodity
data = {}
for metal, ticker in tickers.items():
    print(f"Fetching data for {metal}...")
    data[metal] = yf.download(ticker, start=start_date, end=end_date)

# Store the data in a combined DataFrame
combined_data = pd.DataFrame({
    'Gold_Price': data['Gold']['Adj Close'],
    'Silver_Price': data['Silver']['Adj Close'],
    'Copper_Price': data['Copper']['Adj Close']
})


# Step 1: Load historical data
# Assuming `cpi_data`, `gold_data`, `silver_data`, and `copper_data` are pandas DataFrames
# with 'Date' as the index and daily prices for each instrument.

# Calculate CPI growth rate
df_cpi_growth = df_cpi.pct_change().shift(-1) * 12 * 100

# Step 2: Define financial regimes based on CPI growth
def classify_regime(cpi_growth):
    if cpi_growth > 5:
        return 'Expansion'
    elif 0 < cpi_growth <= 2:
        return 'Recovery'
    elif cpi_growth <= 0:
        return 'Contraction'
    else:
        return 'Expansion'

df_cpi_regime = df_cpi_growth.apply(classify_regime)

# Step 3: Calculate daily returns for gold, silver, and copper
combined_data['Gold_Return'] = combined_data['Gold_Price'].pct_change() * 100
combined_data['Silver_Return'] = combined_data['Silver_Price'].pct_change() * 100
combined_data['Copper_Return'] = combined_data['Copper_Price'].pct_change() * 100

# Step 4: Merge data into a single DataFrame
combined_data = pd.merge_asof(combined_data.sort_values('Date').reset_index(),
                              df_cpi_regime.rename("Regime").sort_index(),
                              left_on='Date',
                              right_index=True,
                              direction='backward')

# Step 5: Create common-sense trading rules
def choose_best_asset(row):
    if row['Regime'] == 'Recovery':
        return 'Silver'  # Silver typically performs well during recovery.
    elif row['Regime'] == 'Expansion':
        return 'Copper'  # Copper benefits from expansion and industrial growth.
    elif row['Regime'] == 'Contraction':
        return 'Gold'  # Gold is a safe haven during contractionary periods.

# Step 6: Apply the strategy
combined_data['Chosen_Asset'] = combined_data.apply(choose_best_asset, axis=1)
パフォーマンスの確認
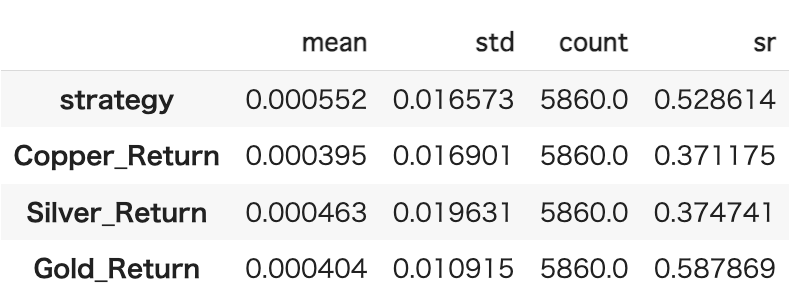
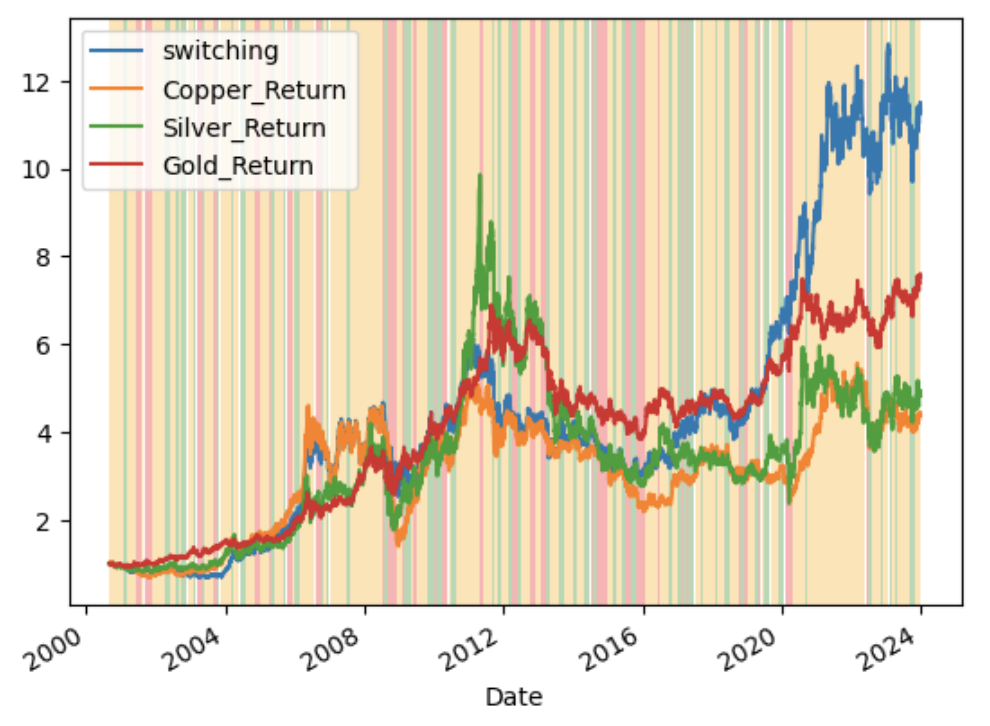
上記の方法でレジームに基づいていずれかの金属を取引した結果は以下のようになりました。(一番上の行が今回の方法に対応)
この期間もっともパフォーマンスがよかった金をSR(安定性の指標)で上回ることはできていませんが、そのときどきで比較的パフォーマンスがよい金属を選ぶことができていそうです。
まとめ
今回の記事ではChatGPTにレジームを定義させて、その時々に適した金属を取引するという戦略を実装させてみました。
レジームの定義はCPIだけでなくGDPのような成長率の指標やイールドカーブの形状など様々な視点から定義することができますが、今回は比較的単純なCPIベースの定義を採用しました。
資産に応じてどのような定義を採用すべきかChatGPTに推薦してもらい、いろいろ試してみるのもありかもしれません。
最後に
グループ研究開発本部 AI研究開発室では、データサイエンティスト/機械学習エンジニアを募集しています。ビッグデータの解析業務などAI研究開発室にご興味を持って頂ける方がいらっしゃいましたら、ぜひ 募集職種一覧 からご応募をお願いします。皆さんのご応募をお待ちしています。
グループ研究開発本部の最新情報をTwitterで配信中です。ぜひフォローください。
Follow @GMO_RD