2017.04.07
ConvNets to Recognize Financial Market Patterns from Technical Indicators
次世代システム研究室のL.G.Wです。今回は畳込みニューラルネットを利用して、株又はFXに利用される複数テクニカル指標からマーケットパターンを認識できるかと実装してみました。
Introduction
In this post, I will share the idea about using ConvNets to classify multi-variate time series, which consist of several technical indicators of financial market.
In securities trading, there are two major and broad methods for investment decisions: fundamental analysis and technical analysis. Fundamental analysis involves analyzing the basic features of a company or a commodity in order to estimate its real value. On the other hand, technical analysis doesn’t care about the “value” of a company or a commodity. Technical analyst are only interested in the price movements in the market, since they believe all events and trading actions will be reflected on market price. Although the proponents of fundamental analysis are quick to call technical analysis the financial world’s alchemy, technical analysis is prevailing among both professional and unprofessional traders.
Here, I do not intend to make judgements about the correctness of these opinions. Instead, I would like to share my thoughts about the strong recognition capability of deep neural network probably and what impact it may have on technical analysis. As you may know, it is extremely difficult for human-beings to recognize patterns or signals when tens of indicator lines are entangled in a chart. However, I think it is a piece of cake for deep learning to classify them, because it has been proven that deep learning, especially ConvNets, has exceptional pattern recognition ability as it has been demonstrated in numerous image classification applications.
Technical Analysis in Financial Market
Technical analysis involves predicting future price movements for securities, such as stocks, commodities, currency, and bonds. The data includes price, time, and volume (unavailable in currency). The concept of technical analysis involves chart types (e.g. Candle Chart, OHLC Bar), price patterns (e.g. rectangle pattern, flag pattern, pennant pattern, head and shoulder pattern), technical indicators (e.g. RSI, MACD, Bollinger Bands), support and resistance theory, trends (uptrend, downtrend, sideways trend).
In this work, I will focus on technical indicators, more specifically momentum indicators. There are tens of indicators, including directional movement index, moving average convergence/divergence (MACD), rate of change, and so on. the following figure shows an example of directional movement index on USD/JPY price, which is generated by ta-lib.
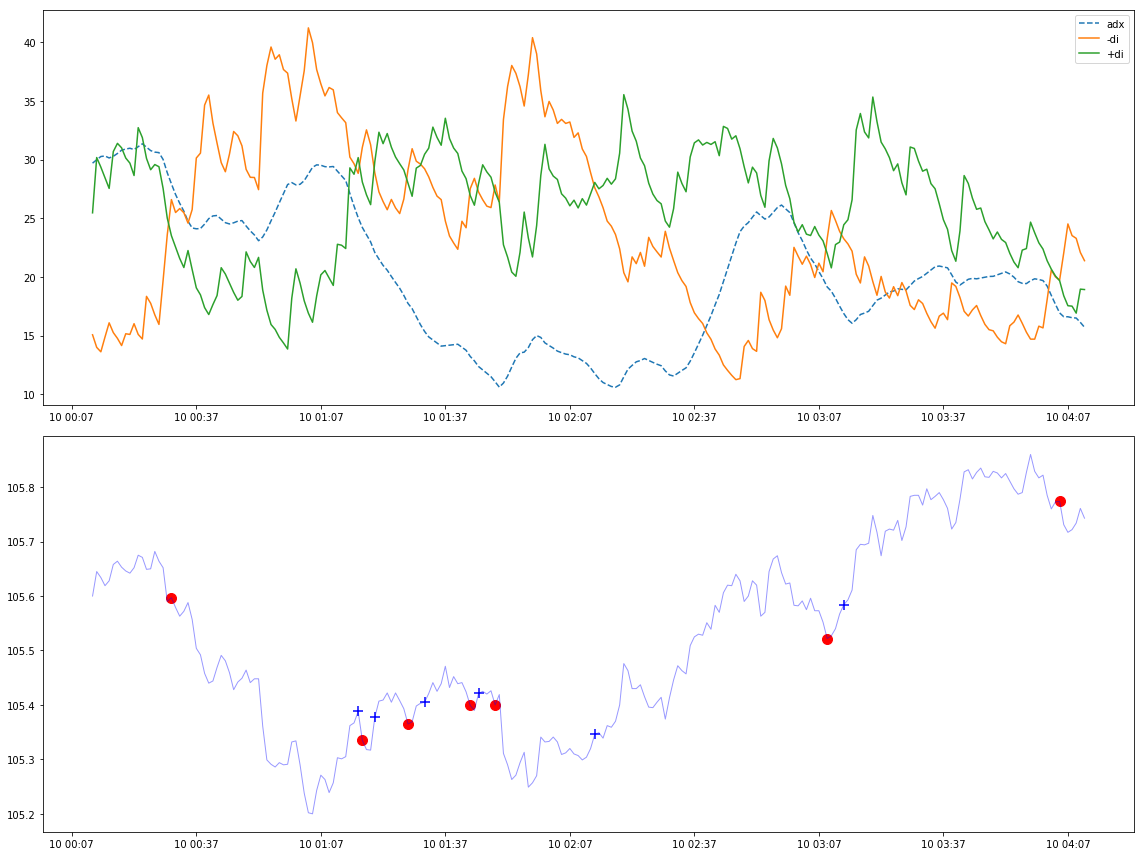
The upper part of the figure above shows three indicators of movement directions: +DI, -DI, ADX. +DI indicates the smoothed strength of up trend, -DI indicates down trend, and ADX is the simple average strength of directional movement. Please refer to here for the detailed calculation. In my case, I directly apply the API provided by ta-lib to get the value as following:
import talib as ta

i_adx = ta.ADX(p_high, p_low, p_close, timeperiod=g_window) #high price, low price, close price

i_mdi = ta.MINUS_DI(p_high, p_low, p_close, timeperiod=g_window)

i_pdi = ta.PLUS_DI(p_high, p_low, p_close, timeperiod=g_window)
Many traders use these three indicators for a simple trading strategy: the first requirement is for ADX to be trading above 25 or 20, then a buy signal occurs when +DI crosses above – DI, a sell signal triggers when -DI crosses above +DI. The lower part of the figure above shows these signals on the price line (noted that it ignores the requirement of ADX): a red circle stands for sell, a blue cross stands for buy.
Modeling
My initial goal is to classify the patterns of MDI rather than determine a trading signal. Thus, I simply apply convolutional neural network on these 3 indicators (+DI, -DI, ADX) for modeling as a classification problem.
Multi-variate Time Series Classification
+DI, -DI, ADX are 3 separated time series data. The problem can be described as multi-variate time series classification. In the literature, researchers have studied for this problem well. Zhiguang Wang and Tim Oates proposed a method (Gramian Angular Fields and Markov Transition Fields) to encode time series for visual classification, which can preserve absolute temporal relations and fully exploits of visual recognition of ConvNets as well. In addition, Yi ZHENG, et al. tried to extract features from every single time series using ConvNets and finally make a classification by concatenating multiple timer series using MLP.
However, my proposal is to stack multi-variate time series as a M-channel matrix, and the temporal relation is kept as spatial relation represented by the row index and the column index of the matrix.
Model Detail
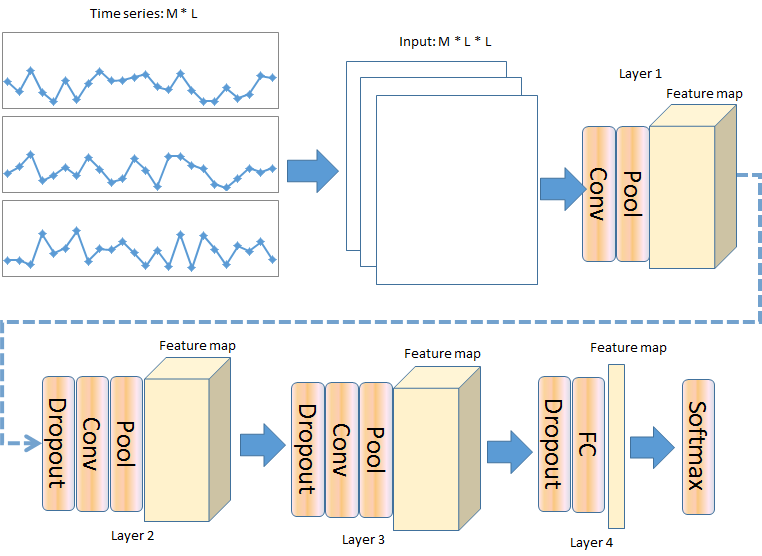
The architecture is shown in the figure above. Three time series (+DI, -DI, ADX) are transformed into 3 diagonal matrix separately, and stacked together. In this case, M = 3, L = 24 which is the length of time frame, and time series are sliced to n M-matrix by sliding. ConvNets are constructed with 4 layers, every layer involves with convolution followed by ReLU activation and max-pooling. After first layer, drop out is added to avoid over-fitting. For the class labels, 6 labels are set as the following rules:
- 0 (neutral): +DI and -DI are never crossed in the time frame
- 1 (buy): +DI crosses above -DI once in the time frame
- 2 (sell): -DI crosses above +DI once in the time frame
- 3 (buy-sell): +Di crosses above -DI and then -DI cross above +DI again in the time frame
- 4 (sell-buy): -Di crosses above +DI and then +DI cross above -DI again in the time frame
- 5 (other): other cases
Experimental Results and Discussion
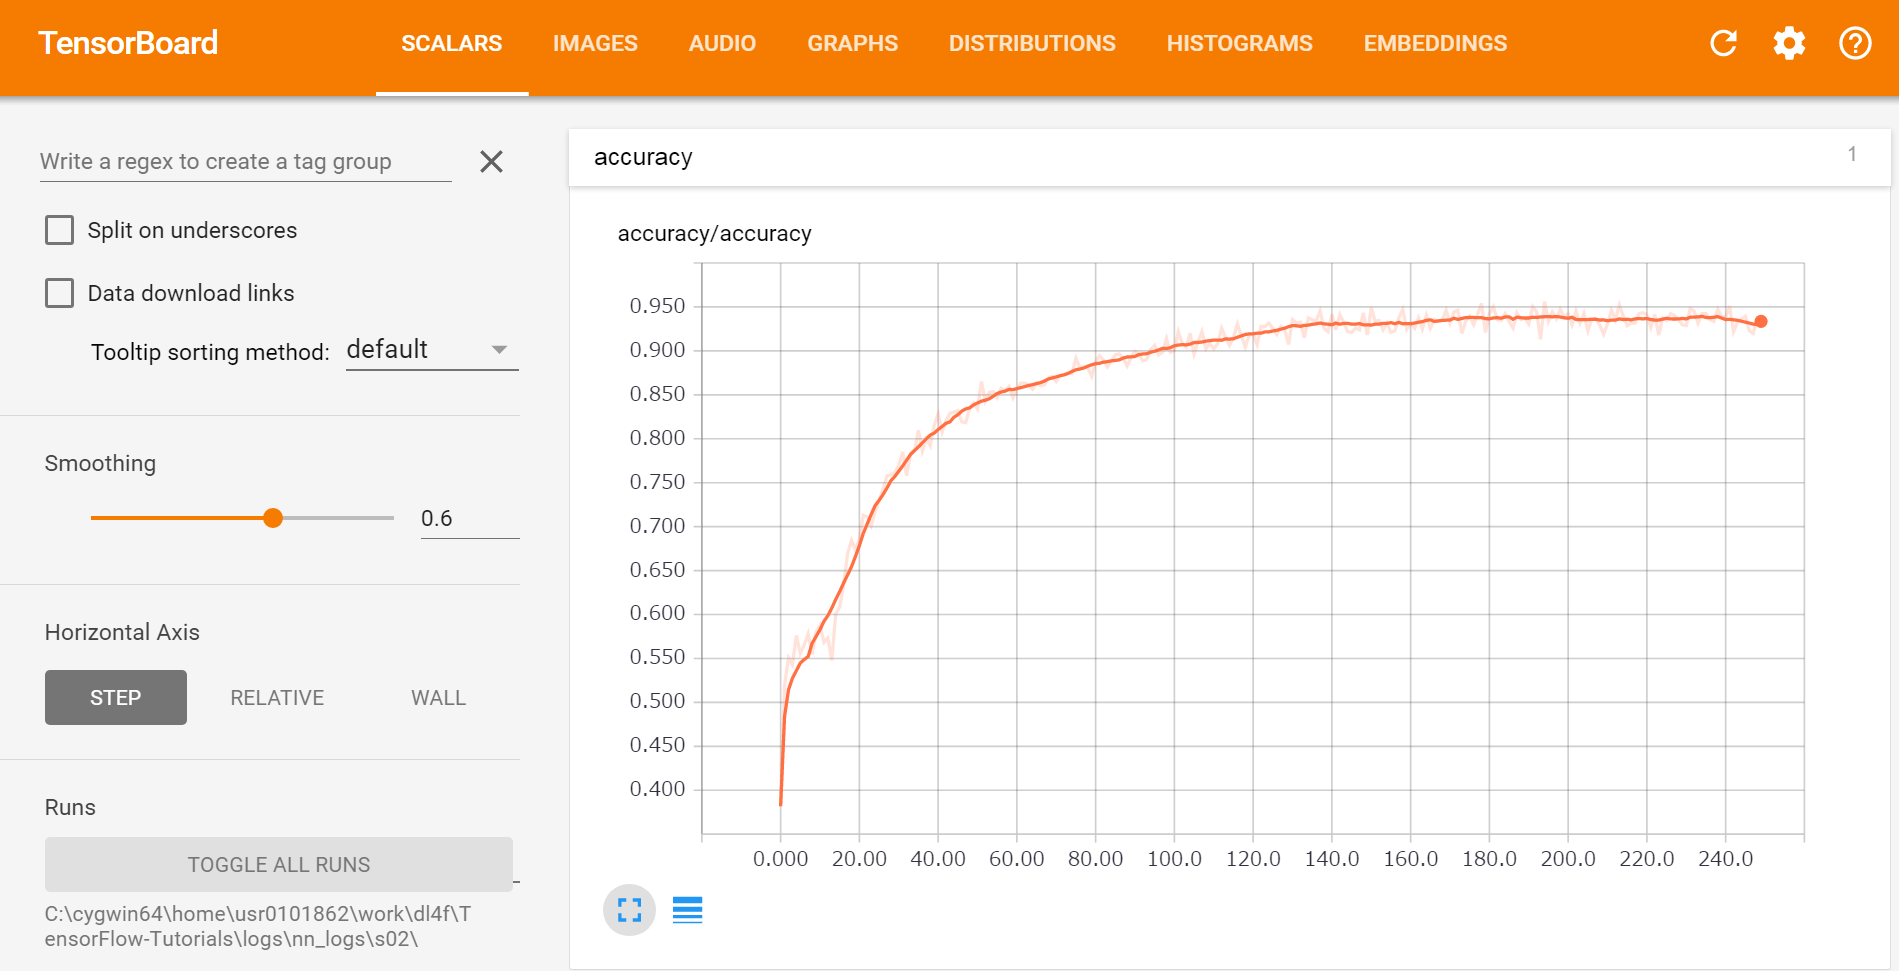
After implemented the model above on Tensorflow, the following result is obtained by run on 1-month Forex data (Forex data is available here). The total accuracy is about 93% after 250 epoches (takes about 2 hours).
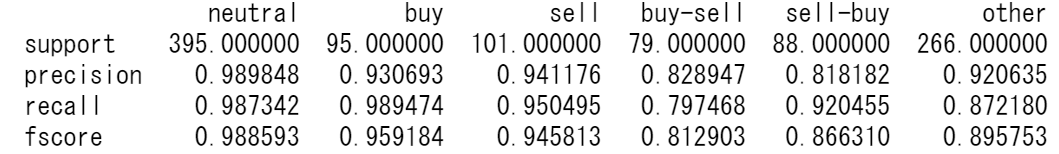
We can see from the result, that simple classes (label=neutral, buy, sell) are highly accurate while complicate classes (label=buy-sell, sell-buy, other) are less than 90%.
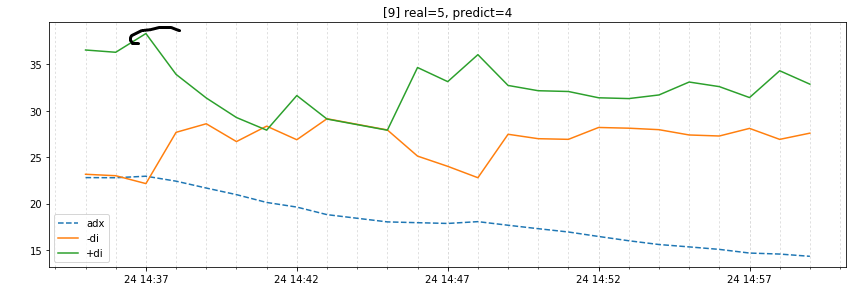
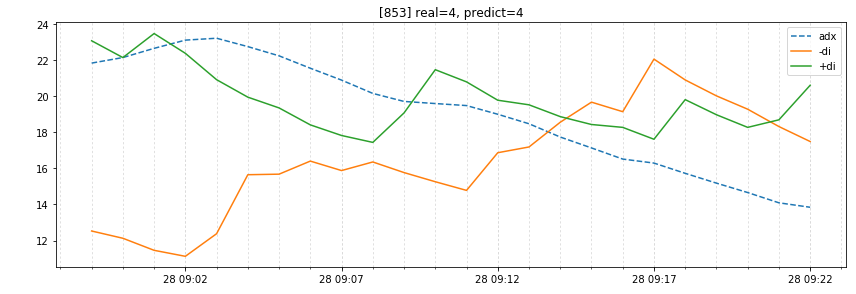
Above is a misclassified example. The correct label is 5, but it is predicted as 4. However, it is really confusing even to human-being if you compare with the correct example below.
By the way, the following figure is from tensor board which can visualize the learning process easily. You can check the accuracy/cost along with epochs, and histogram of all weights of every layer, which is rather convenient to diagnose whether your network is learning properly.
In conclusion, in this piece I attempt to explain ConvNets is capable of recognizing time series patterns, however the final goal is to make use of the market patterns to make investment decision. I will continue to explore it in future, please look forward to my updates.
次世代システム研究室では、ビッグデータ解析プラットホームの設計・開発を行うアーキテクトとデータサイエンティストを募集しています。ご興味を持って頂ける方がいらっしゃいましたら、ぜひ 募集職種一覧 からご応募をお願いします。
皆さんのご応募をお待ちしています。
グループ研究開発本部の最新情報をTwitterで配信中です。ぜひフォローください。
Follow @GMO_RD