2019.12.27
Stackdriver monitoring エージェントでカスタムメトリクスを収集する
こんにちは、次世代システム研究室のN.O.です。
Google Stackdriverは、サービス、コンテナ、アプリケーション、インフラストラクチャのモニタリングを提供するサービスです。GCP(Google Cloud Platform)と統合されており容易に使い始めることができます。今回はこのうちStackdriver monitoringとStackdriver monitoring エージェントを利用して、さまざまなメトリクスを取得することが可能になる、カスタムメトリクスの取得方法についてご紹介します。
Stackdriver monitoringには様々なテンプレートが用意されているので、特にカスタマイズを必要とせずに監視を始めることが可能なのですが、HTTPやHTTPSで提供されるWebサービスを監視するuptime checkでは、チェックする対象が公開されている必要があります。そのため、VPC内など非公開の場所ではuptime checkが使えませんが、このような場面でカスタムメトリクスを活用する事ができます。今回試していく中で、躓いた点など、いくつか知見を得ることができましたので、併せてご紹介します。
Stackdriver monitoring
Stackdriver monitoringは、NagiosやZabbixのようなシステム監視を提供するマネージド型のサービスです。GCPに限らず、AWS上で動作する仮想マシンや、一般的な様々なアプリケーション(Cassandra、Nginx、Apache Web Server、Elasticsearch など)からメトリクスやイベント、メタデータを収集したり、それらを使ってダッシュボードやグラフを表示したり、アラートを飛ばすこともできます。GCPの仮想マシンではそのままでもCPUやネットワーク、ディスクI/Oなどを監視できますが、monitoring エージェントを仮想マシンにインストールすることで、メモリやディスクの使用量、プロセス数なども監視対象とすることができます。
monitoring エージェントでカスタムメトリクスを収集する
実はmonitoring エージェントの実体は collectdという、オープンソースのメトリクス収集ソフトウェアです。また、Stackdriver monitoringではカスタム指標をサポートしています。ということは、collectdで収集できるメトリクスは、Stackdriver monitoringに送ることができるということになります。GCPにエージェントからのカスタム指標というドキュメントがありますので、試しにやってみました。
VPC内にhttp://192.168.0.1/my_service_aというAPIがあり、リクエストが成功するとjson形式で以下のようなレスポンスを返しますとします。
{success:1, data: [...]}
これをカスタムメトリクスとして取得することを考えます。
カスタムメトリクス取得用仮想マシンの用意
Linuxマシンへのインストール手順を参考にカスタムメトリクス取得用の仮想マシンにmonitoring エージェントをインストールします。以下は仮想マシン作成時に、startup-scriptを利用してmonitoring エージェントをインストールするコマンドラインの例です。
gcloud beta compute instances create monitoring-agent-test \
  --zone=us-central1-a \
  --machine-type=f1-micro \
  --subnet=default \
  --network-tier=PREMIUM \
  --metadata=startup-script=curl\ -sSO\ https://dl.google.com/cloudagents/install-monitoring-agent.sh$'\n'sudo\ bash\ install-monitoring-agent.sh \
  --maintenance-policy=MIGRATE \
  --scopes=https://www.googleapis.com/auth/devstorage.read_only,https://www.googleapis.com/auth/logging.write,https://www.googleapis.com/auth/monitoring.write,https://www.googleapis.com/auth/servicecontrol,https://www.googleapis.com/auth/service.management.readonly,https://www.googleapis.com/auth/trace.append \
  --image-family=debian-9 \
  --image-project=debian-cloud \
  --boot-disk-size=10GB \
  --boot-disk-type=pd-standard \
  --boot-disk-device-name=monitoring-agent-test \
  --reservation-affinity=any
collectdフィルタチェーンの設定
ドキュメントに従い、まずはフィルタチェーン/opt/stackdriver/collectd/etc/collectd.d/nginx_curl_json.confを配置します。今回は2か所だけ変更して、TypeInstance "^active-connections$"となっていたところをTypeInstance "^is_success$"に、"custom.googleapis.com/nginx/active-connections"を"custom.googleapis.com/nginx/is_success"としています。
LoadPlugin match_regex
LoadPlugin target_set
LoadPlugin target_replace

# Insert a new rule in the default "PreCache" chain, to divert your metrics.
PreCacheChain "PreCache"
<Chain "PreCache">
  <Rule "jump_to_custom_metrics_from_curl_json">
    # If the plugin name and instance match, this is PROBABLY a metric we're looking for:
    <Match regex>
      Plugin "^curl_json$"
      PluginInstance "^nginx_"
    </Match>
    <Target "jump">
      # Go execute the following chain; then come back.
      Chain "PreCache_curl_json"
    </Target>
  </Rule>
  # Continue processing metrics in the default "PreCache" chain.
</Chain>

# Following is a NEW filter chain, just for your metric.
# It is only executed if the default chain "jumps" here.
<Chain "PreCache_curl_json">

  # The following rule does all the work for your metric:
  <Rule "rewrite_curl_json_my_special_metric">
    # Do a careful match for just your metrics; if it fails, drop down
    # to the next rule:
    <Match regex>
      Plugin "^curl_json$"                   # Match on plugin.
      PluginInstance "^nginx_my_service_.*$" # Match on plugin instance.
      Type "^gauge$"                         # Match on type.
      TypeInstance "^is_success$"    # Match on type instance.
    </Match>

    <Target "set">
      # Specify the metric descriptor name:
      MetaData "stackdriver_metric_type" "custom.googleapis.com/nginx/is_success"
      # Specify a value for the "service_name" label; clean it up in the next Target:
      MetaData "label:service_name" "%{plugin_instance}"
    </Target>

    <Target "replace">
      # Remove the "nginx_" prefix in the service_name to get the real service name:
      MetaData "label:service_name" "nginx_" ""
    </Target>
  </Rule>

  # The following rule is run after rewriting your metric, or
  # if the metric wasn't one of your custom metrics. The rule returns to
  # the default "PreCache" chain. The default processing
  # will write all metrics to Stackdriver monitoring,
  # which will drop any unrecognized metrics: ones that are not
  # in the list of curated metrics and do not have
  # the custom metric metadata.
  <Rule "go_back">
    Target "return"
  </Rule>
</Chain>
メトリクスの設定
メトリクス設定については具体例がないので、collectdのcurl-jsonの設定例を参考に作成し、/opt/stackdriver/collectd/etc/collectd.d/に配置します。
LoadPlugin curl_json

<Plugin curl_json>
  <URL "http://192.168.0.1/my_service_a">
    Host "monitoring-agent-test"
    Instance "nginx_my_service_a"
    <Key "success">
      Type "http_requests"
    </Key>
  </URL>
躓きポイント1 collectd 識別子が足りなかった
これでmonitoring エージェントを再起動すればメトリクスが収集されるはずですが、以下のエラーが発生しました。
collectd[6119]: write_gcm: Server response (CollectdTimeseriesRequest) contains errors:
{
  "payloadErrors": [
    {
      "index": 151,
      "error": {
        "code": 3,
        "message": "Unsupported collectd plugin/type combination: plugin: \"curl_json\" type: \"gauge\""
      }
    }
  ]
}
Unsupported collectd plugin/type combinationとありますので、Typeが良くないのかと思いきや、そうではありません。ドキュメントの受信collectd指標をよく見ると、以下の記述があります。
collectd の指標は次のコンポーネントで構成されている必要があります。
最初の 5 つのコンポーネントが指標の collectd 識別子を構成します。

    Host, Plugin, Plugin-instance, Type, Type-instance, [value]
メトリクスの設定にType-instanceが足りませんでした。
以下の通り修正して再度試します。
<Plugin curl_json>
  <URL "http://192.168.0.1/my_service_a">
    Host "monitoring-agent-test"
    Instance "nginx_my_service_a"
    <Key "success">
      Type "gauge"
      # Type-instanceを追加
      Instance "is_success"
    </Key>
  </URL>
すると、以下のようにエラーメッセージが変化しました。
collectd[2364]: write_gcm: Unsuccessful HTTP request 500: {
  "error": {
    "code": 500,
    "message": "One or more TimeSeries could not be written: An internal error occurred.: timeSeries[0,1]",
    "status": "INTERNAL",
    "details": [
      {
        "@type": "type.googleapis.com/google.monitoring.v3.CreateTimeSeriesSummary",
        "totalPointCount": 2,
        "errors": [
          {
            "status": {
              "code": 13
            },
            "pointCount": 2
          }
        ]
      }
    ]
  }
}
このメッセージは1度きり出た後、再現しませんでした。
この後メトリクスがStackdriver monitoringに表示されるようになりました。
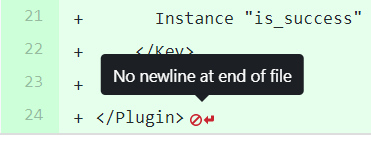
躓きポイント2 collectdの設定ファイルはコードの末尾に改行が必要(POSIX準拠)
VS codeや、Cloud shellのエディタで作成したファイルは、最下行に空の改行を入れないとgitなどでNo newline at end of fileと警告が出る状態になることがあるかと思います。これはPOSIXでファイルの末尾は改行(/nまたはnewline)で終わると定められており、その通りになっていないからです。(筆者も今まで知らなかったのですが、こちらのブログ記事https://thoughtbot.com/blog/no-newline-at-end-of-fileで詳しく解説されており、とても参考になりました)
collectdではこの状態だと正しくファイルを読み込めないようで、結果としてプラグインが読み込まれず、前述のUnsupported collectd plugin/type combinationエラーが発生しました。collectdの設定ファイルでは、最後に改行を入れるようにしてください。
Stackdriver monitoringで収集されたメトリクスを参照する
今回の例では、Stackdriver monitoring->Resources->Metrics Exprolerで、以下のキーで収集されたメトリクスを参照できます。
- Resource Type: GCE VM Instance
- Metric: custom/nginx/is_success
最後に
今回はmonitoring エージェントからカスタムメトリクスを取得する手法についてご紹介しました。Stackdriver monitoringでは様々な監視を行うことができますが、カスタムメトリクスによってさらに柔軟な監視を行うことができますので、ご活用頂ければと思います。
次世代システム研究室では、アプリケーション開発や設計を行うアーキテクト、またはブロックチェーンのエンジニアを募集しています。次世代システム研究室にご興味を持って頂ける方がいらっしゃいましたら、ぜひ 募集職種一覧 からご応募をお願いします。
グループ研究開発本部の最新情報をTwitterで配信中です。ぜひフォローください。
Follow @GMO_RD