2024.10.08
Playing With K8s Observability
こんにちは、次世代システム研究室のN.M.です。
It’s important to have an environment where you can break things without fear. At work, we have been using Prometheus, Grafana, Loki etc. for monitoring and logging in our production environments.
I wanted a similar setup at home, so I could play around with it, experiment and learn more about it.
I have created a K8s cluster using Colima, Kind, and installed Prometheus, Grafana, Loki and Promtail using Helm.
I have a Macbook Pro M1 with 32GB of RAM, and I had to give the VM enough resources to run the monitoring stack.
Be sure to set up the dependencies if you want to follow along.
– Colima
– Kind
– Helm
– kubectl
Colima
Colima is a fast and simple container runtime that allows you to run Docker containers on your Mac without Docker Desktop. It’s a great alternative to Docker Desktop for Mac.
Run the following command to start a Colima VM with enough resources to run the monitoring stack:
colima start --cpu 4 --memory 8 --disk 10
- Now each node in the cluster will have 4 CPUs, 8GB of RAM, and 10GB of disk space.
Fix the `too many open files` error
We need to increase max file descriptors on the Colima VM, otherwise we will get a `too many open files` error.
This was particulary an issue for the `promtail` pod, but it could be an issue for other pods as well.
This also fixes the tailing issue in k8s logs, eg. k9s.
Issue and solution on github
- ssh into the Colima VM
- Make the following changes
-
colima ssh
vi /etc/sysctl.conf
# make the following changes
> fs.inotify.max_user_watches = 1048576
> fs.inotify.max_user_instances = 512
> Run sudo systctl -p or reboot the Colima VM
Kind
Kind is a tool for running local Kubernetes clusters using Docker container “nodes”. It’s a great way to test your K8s manifests locally. I have found it pretty easy to use, and recommend it here.
Let’s create a K8s cluster using kind running on Colima.
– Here is the Kind cluster config file observable-k8s-config.yaml:
# NOTE: Based on the kind-example-config.yaml file from the kind project
kind: Cluster
apiVersion: kind.x-k8s.io/v1alpha4
name: observable-k8s
# patch the generated kubeadm config with some extra settings
kubeadmConfigPatches:
- |
  apiVersion: kubelet.config.k8s.io/v1beta1
  kind: KubeletConfiguration
  evictionHard:
    nodefs.available: "0%"
# patch it further using a JSON 6902 patch
# Don't need this on a local cluster
# kubeadmConfigPatchesJSON6902:
# - group: kubeadm.k8s.io
#   version: v1beta3
#   kind: ClusterConfiguration
#   patch: |
#     - op: add
#       path: /apiServer/certSANs/-
#       value: my-hostname
# 1 control plane node and 3 workers
nodes:
# the control plane node config
# these port mappings allow accessing prometheus, grafana, and the alert manager from the host with localhost,
- role: control-plane
  extraPortMappings:
  - containerPort: 30000 # Prometheus
    hostPort: 30000
  - containerPort: 31000 # Grafana
    hostPort: 31000
  - containerPort: 32000 # Alertmanager
    hostPort: 32000
# workers
- role: worker
  labels:
    observable.k8s/node-type: application
# - role: worker
#     observable.k8s/node-type: application
# - role: worker
#     observable.k8s/node-type: application
The above config file creates a K8s cluster with 1 control plane node and 1 worker node.
It maps the ports for Prometheus, Grafana, and Alertmanager to the host machine.
The worker node has the label observable.k8s/node-type: application.
This is useful for deploying applications to specific nodes.
Create the k8s cluster
➜ kind create cluster --config observable-k8s-config.yaml

Creating cluster "observable-k8s" ...
 ✓ Ensuring node image (kindest/node:v1.30.0) 🖼
 ✓ Preparing nodes 📦 📦
 ✓ Writing configuration 📜
 ✓ Starting control-plane 🕹️
 ✓ Installing CNI 🔌
 ✓ Installing StorageClass 💾
 ✓ Joining worker nodes 🚜
Set kubectl context to "kind-observable-k8s"
You can now use your cluster with:

kubectl cluster-info --context kind-observable-k8s

Have a question, bug, or feature request? Let us know! https://kind.sigs.k8s.io/#community 🙂
My kubectl was set to the kind-observable-k8s context automatically, so I could just start using it to interact with the new cluster.
- Here is some information on setting up kubectl if you need it: https://kubernetes.io/docs/reference/kubectl/quick-reference/#kubectl-context-and-configuration
Now that we have a K8s cluster, we can install the monitoring stack using Helm.
Helm
Helm is a package manager for Kubernetes that allows you to define, install, and upgrade complex Kubernetes applications.
It has the concept of charts, which are packages of pre-configured Kubernetes resources.
It uses a templating engine to generate the Kubernetes yaml taking in values from a values.yaml file that you provide.
In this way, you can customize the installation of the application to your needs.
Prometheus
Prometheus is a monitoring and alerting toolkit. It collects metrics from configured targets at given intervals, evaluates rule expressions, displays the results, and can trigger alerts if some condition is observed to be true.
This package includes Grafana, Prometheus, and AlertManager.
Grafana
Grafana is a multi-platform open-source analytics and interactive visualization web application. It provides charts, graphs, and alerts for the web when connected to supported data sources.
AlertManager
AlertManager handles alerts sent by client applications such as the Prometheus server. It takes care of deduplicating, grouping, and routing them to the correct receiver integration such as email, Slack, PagerDuty, or OpsGenie.
We won’t be using AlertManager in this setup, but it’s included in the kube-prometheus-stack Helm chart.
Add the Prometheus and stable Helm repositories
helm repo add prometheus-community https://prometheus-community.github.io/helm-charts
helm repo add stable https://charts.helm.sh/stable
helm repo update
Create a namespace for the monitoring stack
- We will separate the monitoring stack components into separate namespaces for easy management
kubectl create namespace kps
install kube-prometheus-stack
➜ helm install kind-prometheus prometheus-community/kube-prometheus-stack --namespace kps --set prometheus.service.nodePort=30000 --set prometheus.service.type=NodePort --set grafana.service.nodePort=31000 --set grafana.service.type=NodePort --set alertmanager.service.nodePort=32000 --set alertmanager.service.type=NodePort --set prometheus-node-exporter.service.nodePort=32001 --set prometheus-node-exporter.service.type=NodePort

NAME: kind-prometheus
LAST DEPLOYED: Mon Oct  7 21:58:10 2024
NAMESPACE: kps
STATUS: deployed
REVISION: 1
NOTES:
kube-prometheus-stack has been installed. Check its status by running:
  kubectl --namespace kps get pods -l "release=kind-prometheus"

Visit https://github.com/prometheus-operator/kube-prometheus for instructions on how to create & configure Alertmanager and Prometheus instances using the Operator.
- As we install the components, we will be prompted to check the status of the installation, with various commands
- It is advisable to follow the instructions given in the output to verify the installation
Loki
Loki is a horizontally-scalable, highly-available, multi-tenant log aggregation system inspired by Prometheus. It is designed to be very cost-effective and easy to operate, as it does not index the contents of the logs, but rather a set of labels for each log stream.
Loki also has options for a more lightweight deployment, which we will use in this setup.
Here is the values.yaml for Loki:
deploymentMode: SingleBinary
loki:
  commonConfig:
    replication_factor: 1
  storage:
    type: 'filesystem'
  schemaConfig:
    configs:
    - from: "2024-01-01"
      store: tsdb
      index:
        prefix: loki_index_
        period: 24h
      object_store: filesystem # we're storing on filesystem so there's no real persistence here.
      schema: v13
  auth_enabled: false

singleBinary:
  replicas: 1
read:
  replicas: 0
backend:
  replicas: 0
write:
  replicas: 0

# Restrict the resources for the chunksCache component, otherwise it will be undeployable on a kind cluster
chunksCache:
  resources:
    requests:
      memory: 1Gi
      cpu: 500m
    limits:
      memory: 1Gi
      cpu: 500m
The above values file is used to customize the installation of Loki, for our local kind cluster.
- We are using the SingleBinary deployment mode, which deploys Loki as a single binary, and uses much less resources than the other deployment modes
- The other options are micro-service and simple scalable
- reference: https://grafana.com/docs/loki/latest/get-started/deployment-modes/
- We are using the filesystem storage type, which stores logs on the filesystem, rather than a cloud storage provider
- You would probably use a cloud storage provider such as GCS, S3, or Azure Blob Storage in a production environment
- We are disabling authentication for simplicity, but you would enable it in a production environment
- This means that the Loki API doesn’t require authentication and doesn’t support multi-tenancy
- We are setting the replication_factor to 1, which means that logs are not replicated across multiple instances
- This is fine for a single-node setup, but you would want to increase this in a production environment
- We are setting the chunksCache resource limits to prevent the chunksCache component from using too many resources
- This is necessary because, by default, the chunksCache component uses 10Gi of memory
create namespace loki
kubectl create namespace loki
install loki
➜ helm install --values ./kubernetes-event-exporter-test/loki/values.yaml loki grafana/loki --namespace loki

NAME: loki
LAST DEPLOYED: Mon Oct  7 22:02:15 2024
NAMESPACE: loki
STATUS: deployed
REVISION: 1
NOTES:
***********************************************************************
 Welcome to Grafana Loki
 Chart version: 6.16.0
 Chart Name: loki
 Loki version: 3.1.1
***********************************************************************

** Please be patient while the chart is being deployed **

Tip:

  Watch the deployment status using the command: kubectl get pods -w --namespace loki

If pods are taking too long to schedule make sure pod affinity can be fulfilled in the current cluster.

***********************************************************************
Installed components:
***********************************************************************
* loki

Loki has been deployed as a single binary.
This means a single pod is handling reads and writes. You can scale that pod vertically by adding more CPU and memory resources.

***********************************************************************
Sending logs to Loki
***********************************************************************

Loki has been configured with a gateway (nginx) to support reads and writes from a single component.

You can send logs from inside the cluster using the cluster DNS:

http://loki-gateway.loki.svc.cluster.local/loki/api/v1/push

You can test to send data from outside the cluster by port-forwarding the gateway to your local machine:

  kubectl port-forward --namespace loki svc/loki-gateway 3100:80 &

And then using http://127.0.0.1:3100/loki/api/v1/push URL as shown below:

curl -H "Content-Type: application/json" -XPOST -s "http://127.0.0.1:3100/loki/api/v1/push"  \
--data-raw "{\"streams\": [{\"stream\": {\"job\": \"test\"}, \"values\": [[\"$(date +%s)000000000\", \"fizzbuzz\"]]}]}"

Then verify that Loki did received the data using the following command:

curl "http://127.0.0.1:3100/loki/api/v1/query_range" --data-urlencode 'query={job="test"}' | jq .data.result

***********************************************************************
Connecting Grafana to Loki
***********************************************************************

If Grafana operates within the cluster, you'll set up a new Loki datasource by utilizing the following URL:

http://loki-gateway.loki.svc.cluster.local/
- The above output information is especially helpful for confirming a successful install, and interacting with the Loki API and sending logs to Loki
- Take note of the Loki gateway URL, as you will need it to configure Grafana to use Loki as a datasource
Promtail
Promtail is an agent which sends the contents of logs to Loki. It is usually deployed as a DaemonSet in a K8s cluster.
We will use the following values file to customize the installation of Promtail:
config:
  clients:
    - url: http://loki-gateway.loki.svc.cluster.local/loki/api/v1/push
      # when Loki has auth-enabled:false, loki runs in single-tenant mode, so we don't need to set tenant_id
      # https://grafana.com/docs/loki/latest/operations/multi-tenancy/
      # tenant_id: 1

affinity:
  nodeAffinity:
    requiredDuringSchedulingIgnoredDuringExecution:
      nodeSelectorTerms:
        - matchExpressions:
            - key: observable.k8s/node-type
              operator: In
              values:
                - application
- Note that we configured the loki URL to the same value as was given in the Loki installation output
- We also set the nodeAffinity to only deploy Promtail to the worker node with the label observable.k8s/node-type: application. We set this label earlier in the Kind cluster configuration.
create namespace promtail
kubectl create namespace promtail
install Promtail
helm install --values ./kubernetes-event-exporter-test/promtail/values.yaml promtail grafana/promtail --namespace promtail
Kubernetes Event Exporter
The Kubernetes Event Exporter is a tool that exports Kubernetes events to Loki. It is useful for monitoring and alerting on Kubernetes events.
We will use the following values.yaml to customize the installation of the Kubernetes Event Exporter:
replicaCount: 1

image:
  repository: bitnami/kubernetes-event-exporter
  pullPolicy: IfNotPresent
  # Overrides the image tag whose default is the chart appVersion.
  tag: 1.7.0-debian-12-r15

imagePullSecrets: []
nameOverride: ""
fullnameOverride: ""

serviceAccount:
  # Specifies whether a service account should be created
  create: true
  # Annotations to add to the service account
  annotations: {}
  # The name of the service account to use.
  # If not set and create is true, a name is generated using the fullname template
  name: ""

service:
  type: ClusterIP
  port: 2112

## Override the deployment namespace
namespaceOverride: "kube-event-exporter"

rbac:
  # If true, create & use RBAC resources
  create: true

resources:
   limits:
     cpu: 100m
     memory: 128Mi
   requests:
     cpu: 100m
     memory: 128Mi

nodeSelector:
    observable.k8s/node-type: application

affinity: {}

config:
  logLevel: debug
  logFormat: json
  route:
    routes:
      - match:
        - receiver: "loki"
        drop:
        - namespace: "kube-event-exporter"
        # Catch all events besides Normal, prevents the events overloading the loki instance
        # - type: "Normal"
  receivers:
    - name: "loki"
      loki:
        # When loki has auth-enabled:false we don't need to set X-Scope-OrgID header
        # headers:
        #   X-Scope-OrgID: "default"
        streamLabels:
          events: "kube-event-exporter"
        url: http://loki-gateway.loki.svc.cluster.local/loki/api/v1/push
- We configure the Kubernetes Event Exporter to export events to the same Loki gateway URL as was given in the Loki installation output
- We don’t need to set the `X-Scope-OrgID` header because Loki is running in single-tenant mode
- We create a streamLabel, events: “kube-event-exporter”, to identify the events exported by the Kubernetes Event Exporter
- you will see how this is useful when querying the events in Grafana
create namespace kube-event-exporter
kubectl create namespace kube-event-exporter
Install the Kubernetes Event Exporter
helm install --values ./kubernetes-event-exporter-test/kubernetes-event-exporter/values.yaml kube-event-exporter oci://registry-1.docker.io/bitnamicharts/kubernetes-event-exporter --namespace kube-event-exporter
- You may want to install a sample web app to test out the observability.
- Now you can log-in to the Grafana dashboard and start exploring the logs and events
- The default username and password for Grafana is admin and prom-operator
First, create a Loki datasource as shown in this image:
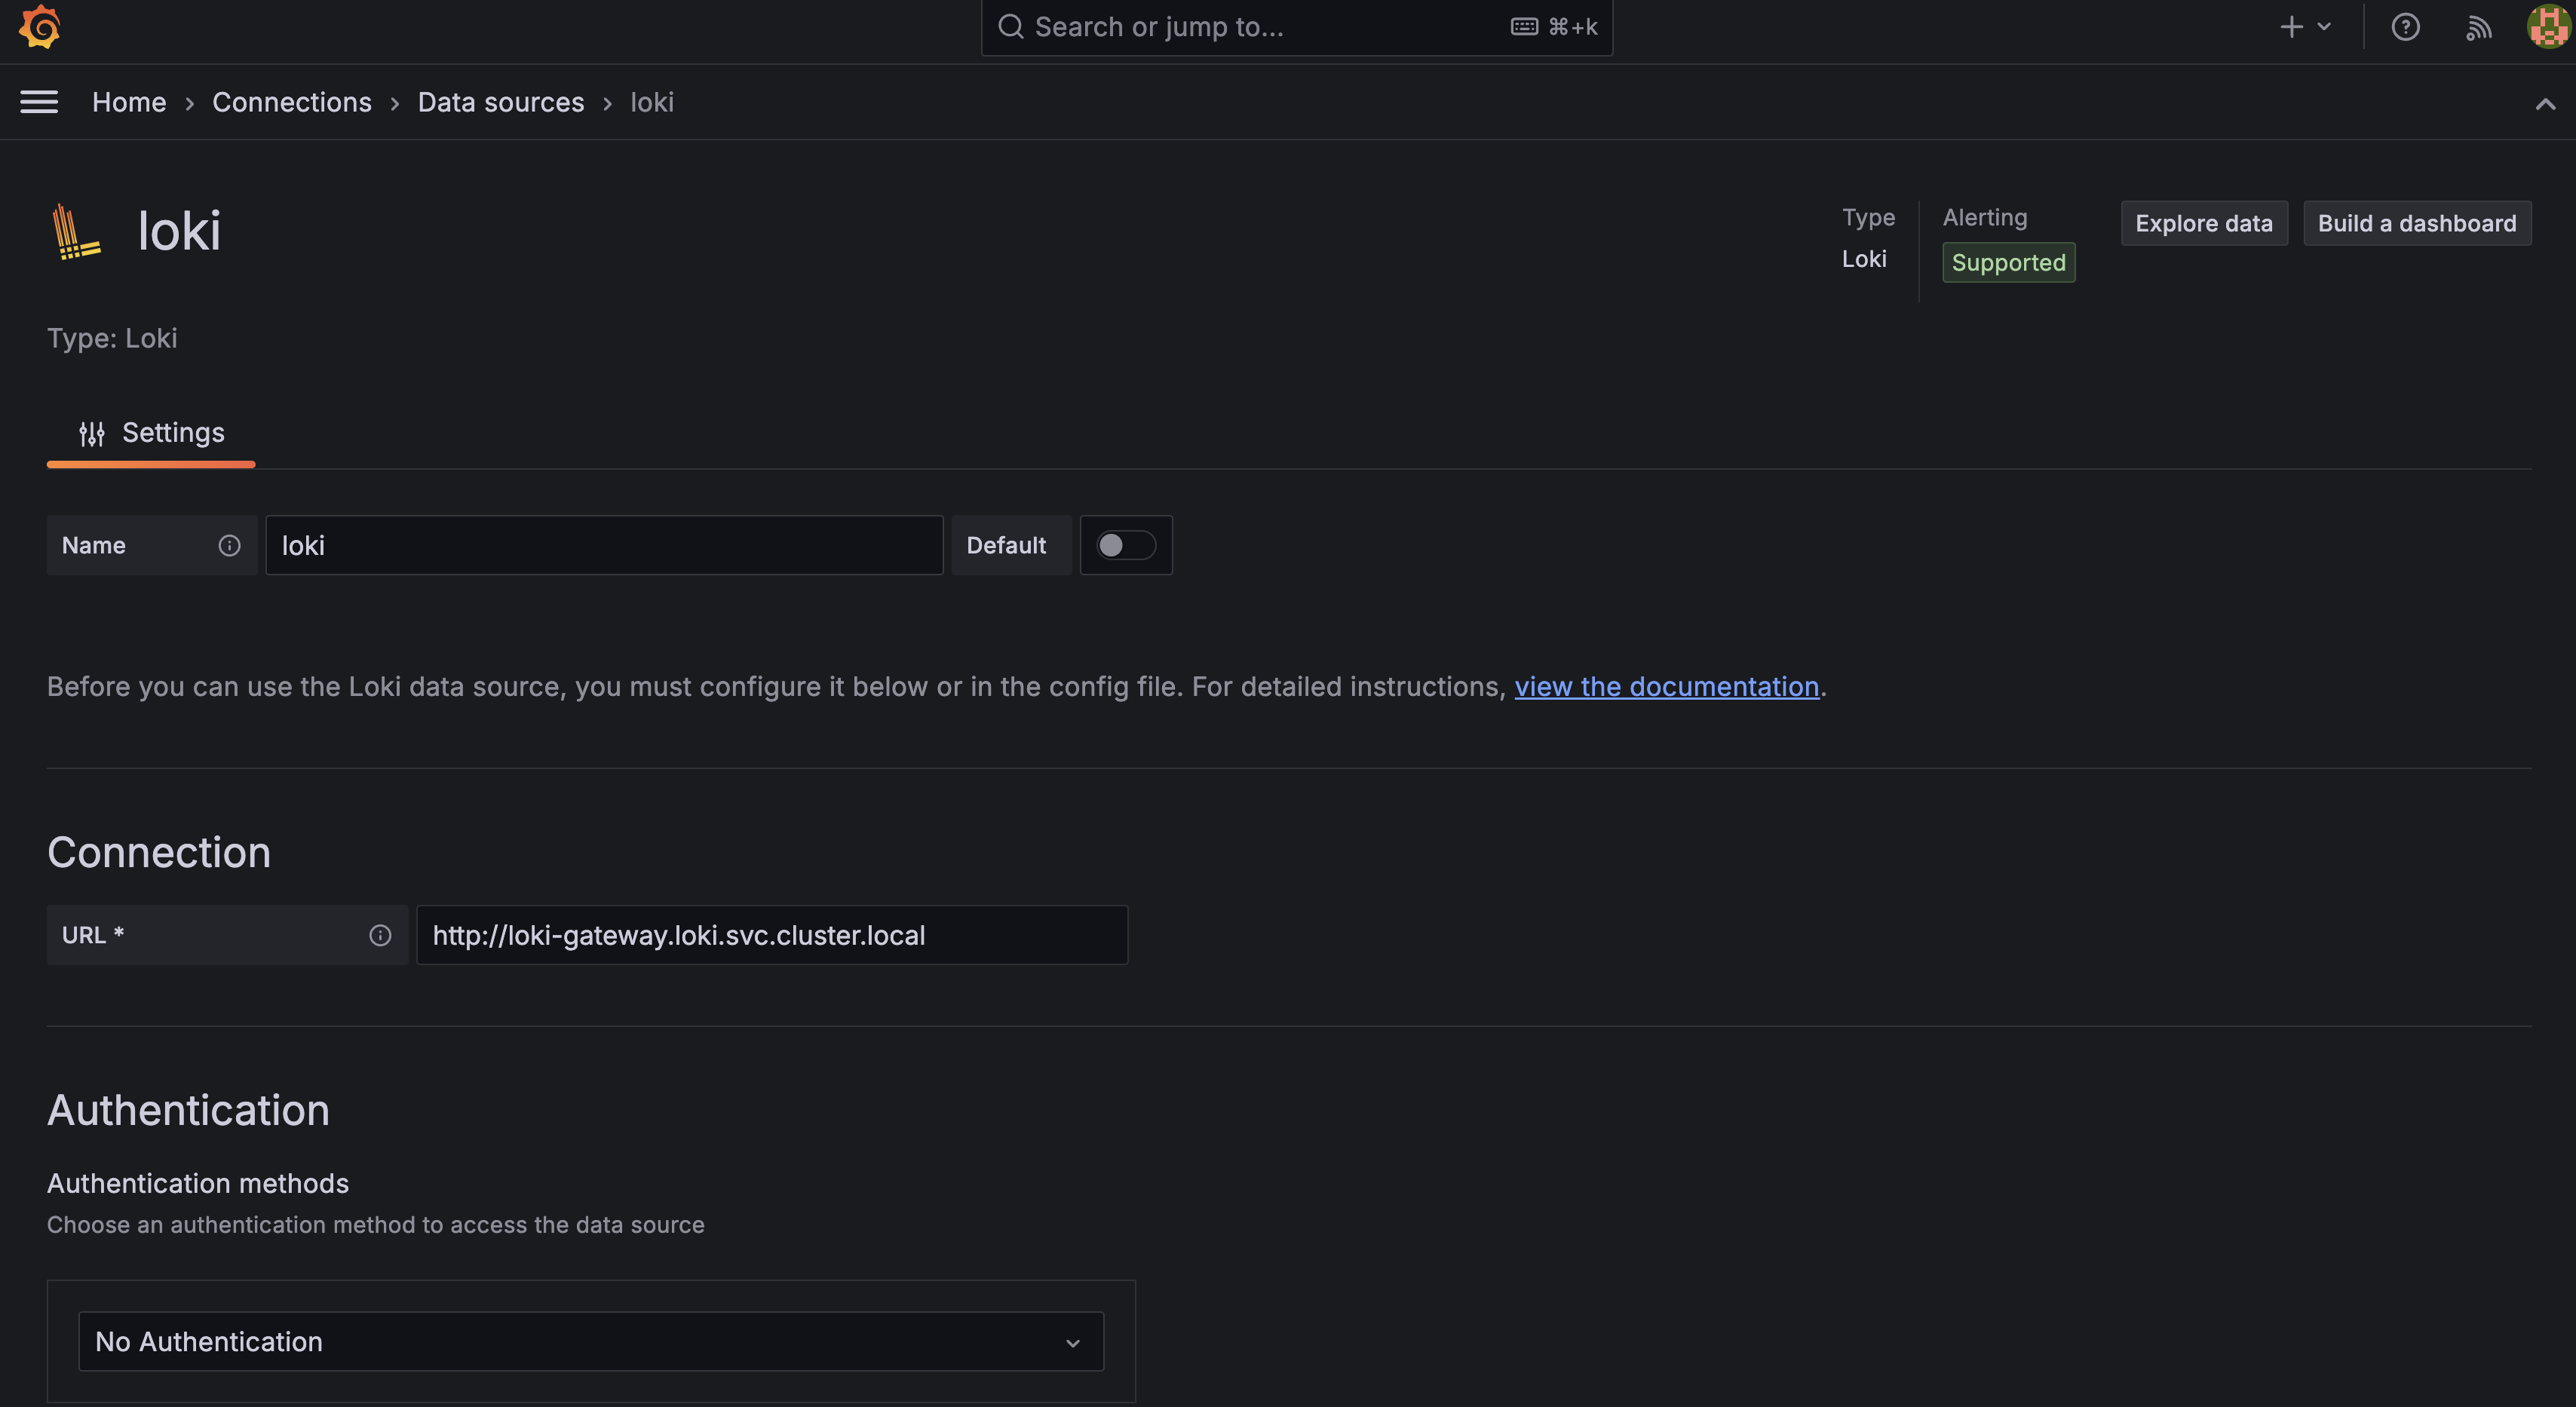
- It’s not shown here but you can click on the button at the bottom of the page to save and test the datasource.
- Be sure to use the same URL, that you have been using up to now for the Loki API: http://loki-gateway.loki.svc.cluster.local/loki/api/v1/label/app/values
You can explore the Kubernetes events in Grafana as shown below:
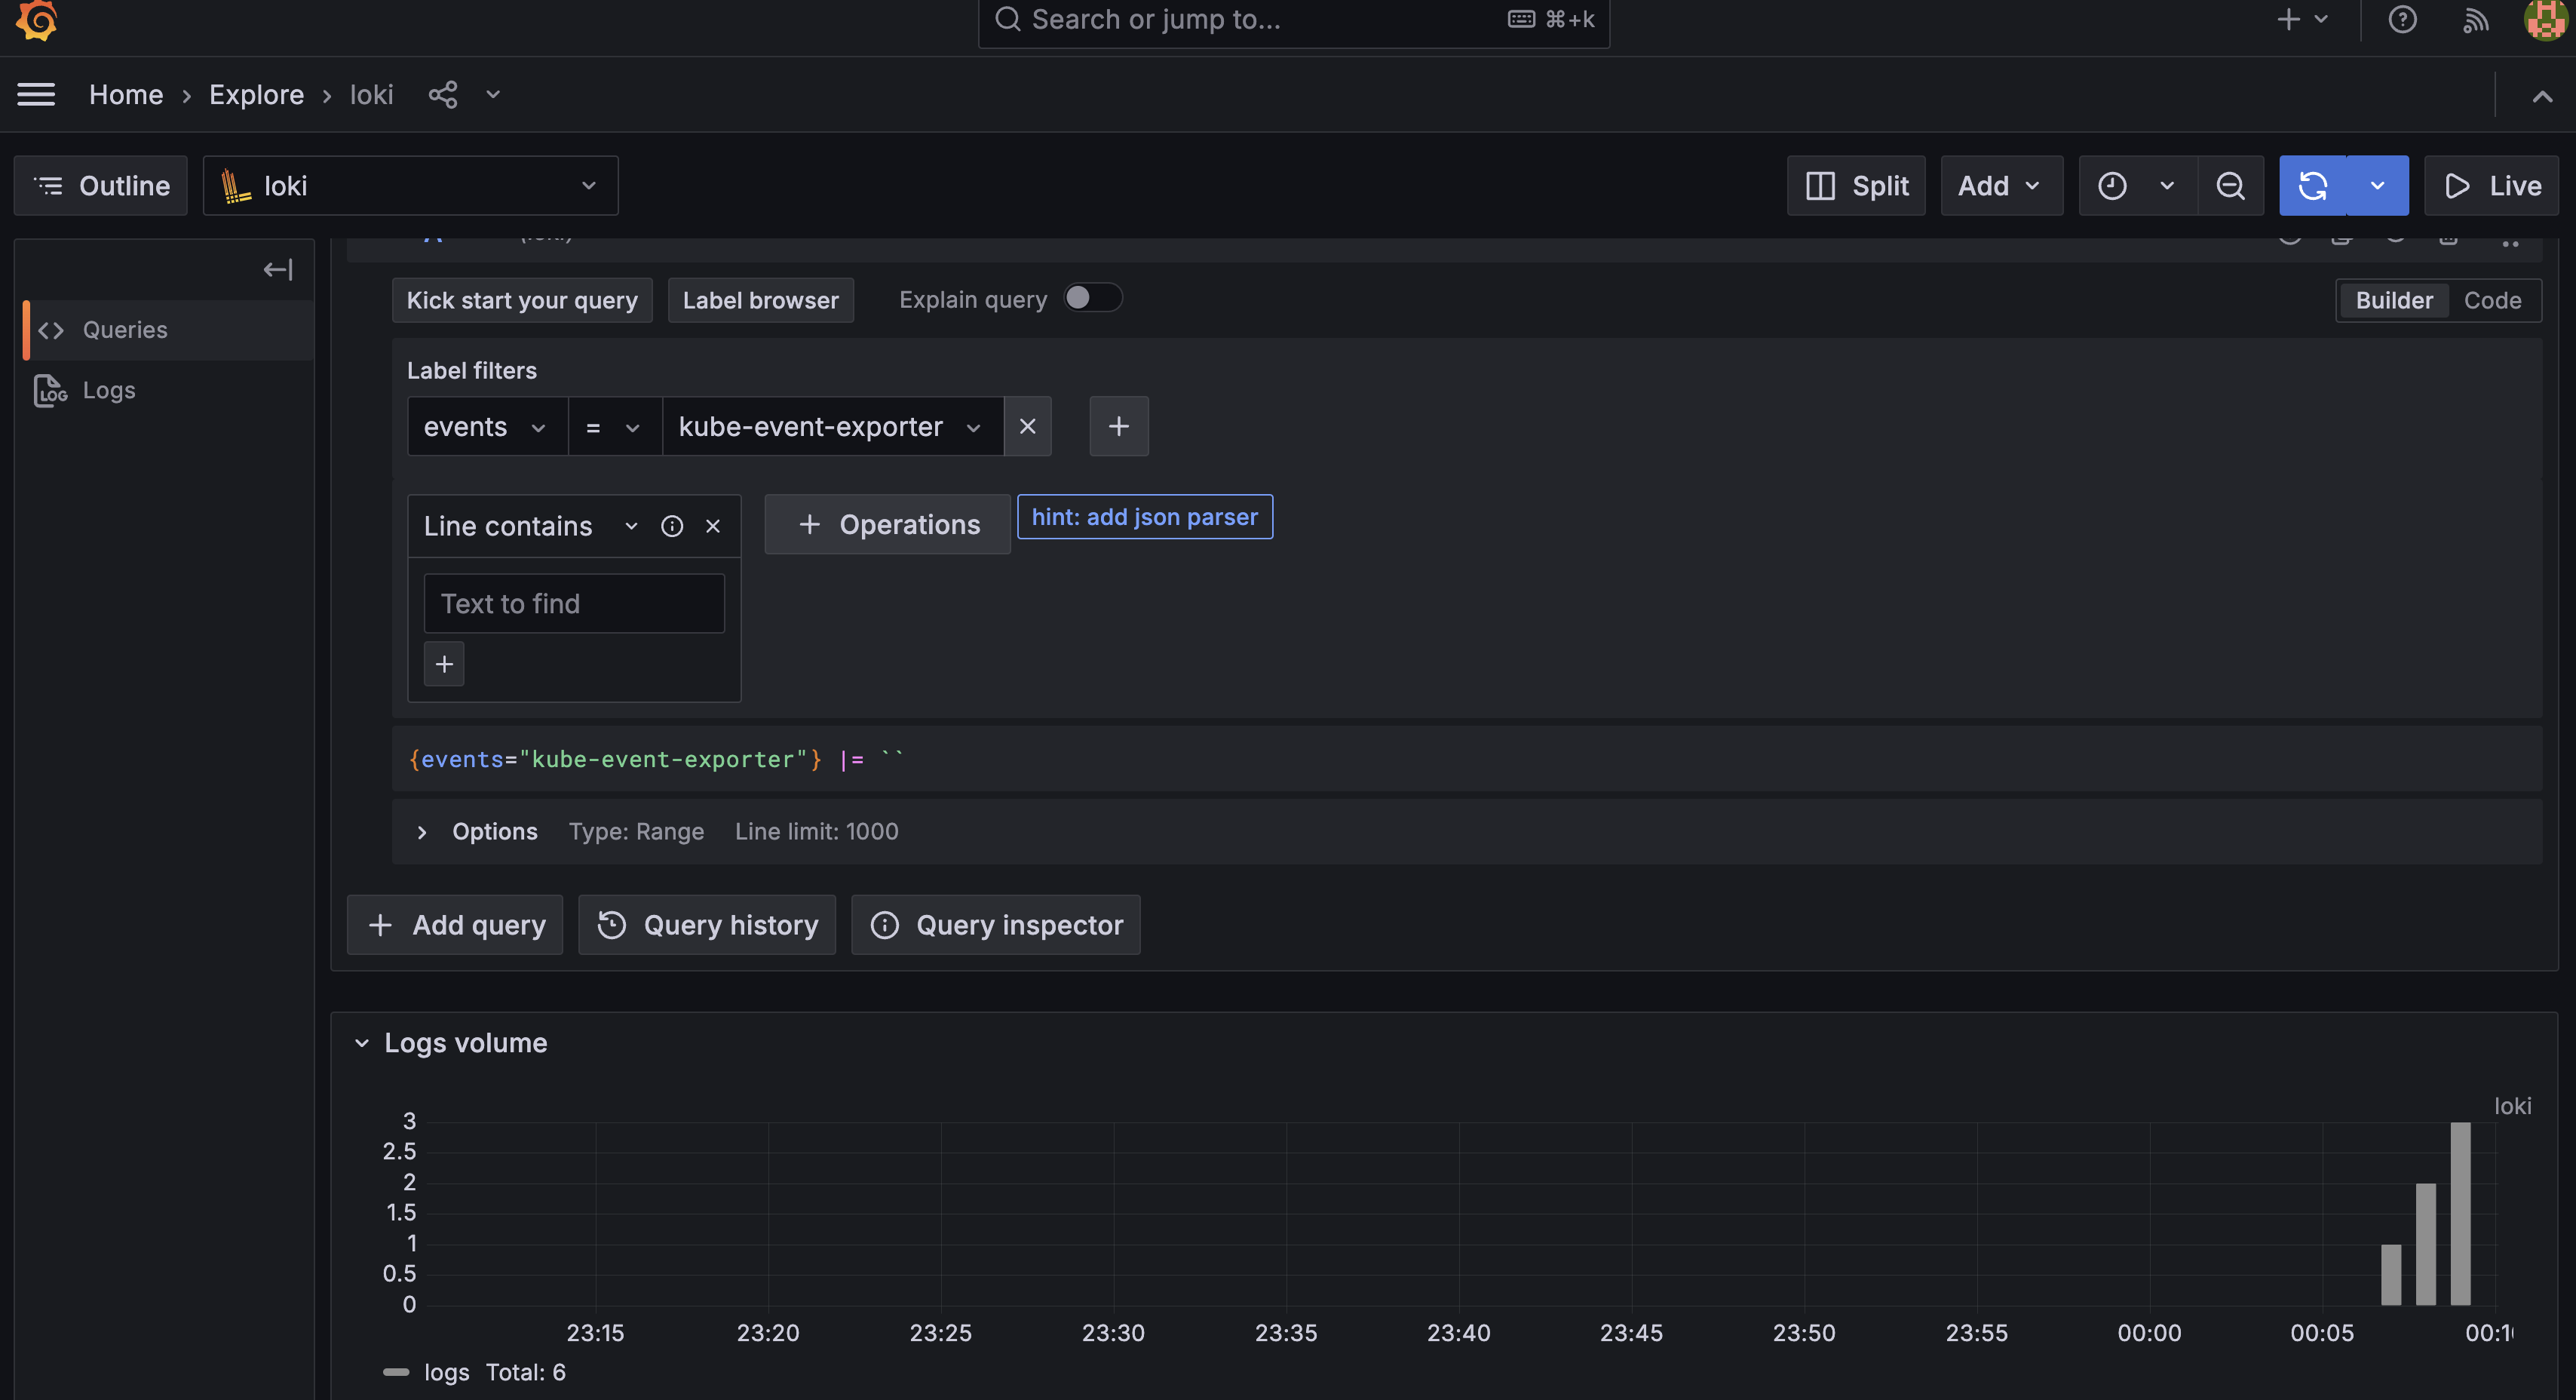
Note that the label filter is the same as configured in the Kubernetes Event Exporter values.yaml. This is why we want to think carefully, about how we create these labels because they make it easier to query the log data in Grafana.
Now you are free to explore the monitoring stack and learn more about how to use it.
A great way to start would be to create a dashboard in Grafana to visualize the logs and events.
I recommend this youtube video to get started with creating dashboards: https://www.youtube.com/watch?v=EPLvB1eVJJk
Useful Commands
Delete the Kind cluster. While playing around, I used this one a lot!
kind delete cluster --name observable-k8s
For each of the helm charts installed, you can get the values used for the installation using the following command:
helm get values <release-name> --namespace <namespace>
You can also get all possible values that can be set for the chart using the following command:
helm show values <chart-name>
You can update the values for a release using the following command:
helm upgrade --values <values-file> <release-name> <chart-name> --namespace <namespace>
- So, now we know how to install helm charts, customize them using values files, and update them
- If you are ever confused about the values that can be set for a chart, you can always refer to the chart’s documentation or use the helm show values command
Port-forward ClusterIP services to access them from the host machine:
kubectl port-forward svc/<service-name> <host-port>:<service-port> -n <namespace>
grafana URL
http://localhost:31000/graph
Access Loki API from within kubernetes:
curl http://loki-gateway.loki.svc.cluster.local/loki/api/v1/labels
test push endpoint:
DATE_TIME=$(($(date +%s) * 1000000000))
# 1728037923000000000
curl -s -X POST "http://loki-gateway.loki.svc.cluster.local/loki/api/v1/push" \
  --data-raw '{"streams": [{ "stream": { "foo": "bar2" }, "values": [ [ "'$DATE_TIME'", "fizzbuzz" ] ] }]}'
Query loki
START_DATE_TIME=$(($(date +%s) * 1000000000 - 7200000000000))
END_DATE_TIME=$(($(date +%s) * 1000000000))
curl -G --data-urlencode 'query={foo="bar2"}' \
     http://loki-gateway.loki.svc.cluster.local/loki/api/v1/query_range
Network Tools
- A simple pod, with all the necessary network tools to test connectivity. Very useful for querying the Loki API for example.
kubectl apply -f - <<EOF
apiVersion: v1
kind: Pod
metadata:
  name: network-tools
  labels:
    purpose: network-diagnosis
  namespace: network-tools
spec:
  containers:
  - name: netshoot
    image: nicolaka/netshoot
    command: ["sleep"]
    args: ["3600"]
EOF
Using the Kubernetes Event Exporter event values as stream labels in Loki
This functionality was added to the Kubernetes Event Exporter in a recent PR.
It looks usefull, because it will allow you to filter events in Loki based on the actual source of the event.
So if you have multiple applications sending events to Loki, you can easily filter them based on the application name for example.
This is still possible to do without the stream labels, but the log data must be parsed to extract the application name.
- Issue: https://github.com/resmoio/kubernetes-event-exporter/issues/185
- PR: https://github.com/resmoio/kubernetes-event-exporter/pull/200/files
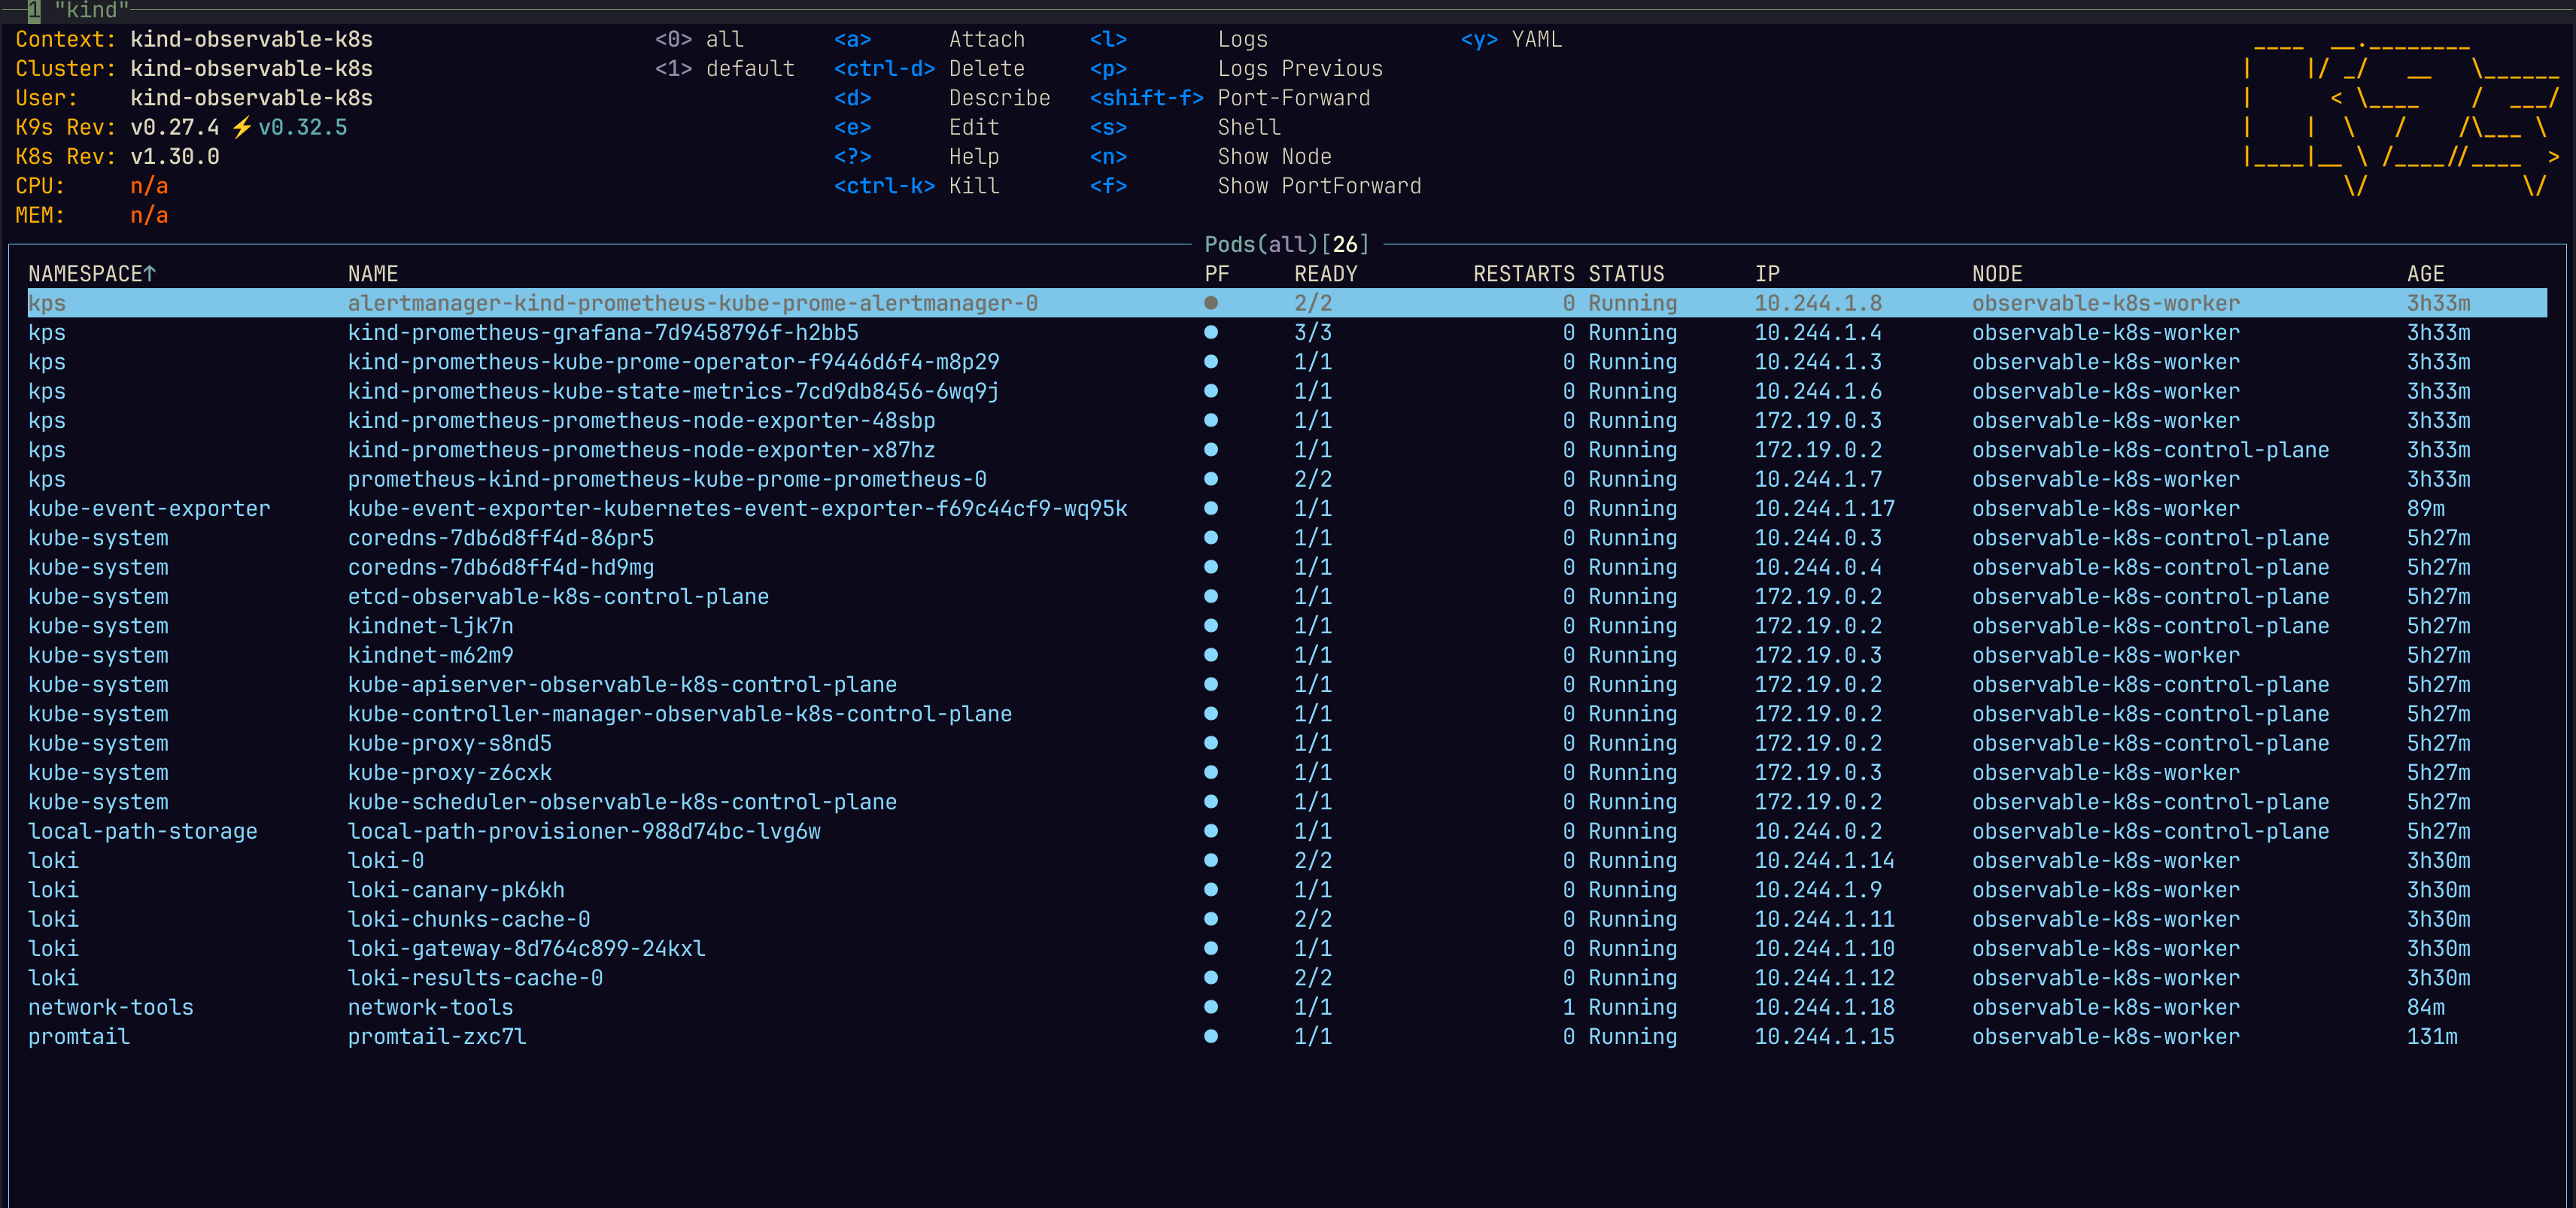
Lastly, here is an image showing all of the pods installed in this article:
References
– Deploying Prometheus on a Kind cluster using Helm: https://hackmd.io/@OrALpDtKSY6QetSsHgj-IA/BJXuuNmYP
– Kind, Quick Start: https://kind.sigs.k8s.io/docs/user/quick-start/
– kube-prometheus-stack (kps): https://github.com/prometheus-community/helm-charts/tree/main/charts/kube-prometheus-stack
– Digital Ocean, Installing the Prometheus Stack: https://github.com/digitalocean/Kubernetes-Starter-Kit-Developers/blob/main/04-setup-observability/prometheus-stack.md#step-1—installing-the-prometheus-stack
– Loki, Install the monolithic Helm chart: https://grafana.com/docs/loki/latest/setup/install/helm/install-monolithic/
– kubernetes-event-exporter: https://github.com/resmoio/kubernetes-event-exporter
– Loki helm chart components: https://grafana.com/docs/loki/latest/setup/install/helm/concepts/
– Deploying Prometheus on a Kind Cluster using Helm: https://hackmd.io/@OrALpDtKSY6QetSsHgj-IA/BJXuuNmYP
次世代システム研究室では、グループ全体のインテグレーションを支援してくれるアーキテクトを募集しています。インフラ設計、構築経験者の方、次世代システム研究室にご興味を持って頂ける方がいらっしゃいましたら、ぜひ募集職種一覧からご応募をお願いします。
グループ研究開発本部の最新情報をTwitterで配信中です。ぜひフォローください。
Follow @GMO_RD

