2024.11.11
ニュース情報からLLMを使用して企業間関係グラフの生成

目次
はじめに
企業間の関係性を正確かつ迅速に把握することは、ビジネス戦略の策定や市場分析において不可欠です。しかし、現代のビジネス環境は情報の洪水とも言える状況であり、膨大なニュース記事や報道から有用な情報を抽出することは容易ではありません。一方で、近年の人工知能(AI)技術の進化、特に大規模言語モデル(LLM)の登場により、自然言語からの情報抽出や知識グラフの構築が飛躍的に向上しています。
この手法の有用性は以下の点にあります:
- 迅速な情報収集と分析:大量のニュース記事から必要な情報を短時間で抽出し、分析することで、タイムリーな意思決定が可能になります。
- 関係性の可視化:テキスト情報をグラフ形式で視覚化することで、複雑な企業間の関係性を直感的に理解できます。
- ビジネスインサイトの発掘:競合他社の動向や新たなパートナーシップ、業界のトレンドなどを把握し、ビジネス戦略に活用できます。
- リスク管理の強化:取引先や関連企業のネガティブなニュースを早期に検知し、リスク対策を講じることができます。
LLMを用いたテキスト解析
LLMの概要と選定理由
LLM(大規模言語モデル)は、膨大なテキストデータを基に学習された人工知能モデルであり、自然言語の理解と生成に卓越した能力を持ちます。このプロジェクトでLLMを選択した主な理由は以下の通りです:
- 高精度なテキスト解析能力LLMは文脈理解に優れており、単語単位だけでなく文章全体の意味を捉えることができます。これにより、ニュース記事から企業名やその関係性といった具体的な情報を高い精度で抽出できます。
- 学習済みモデルの活用による効率化既に大規模データで学習されたモデルを使用することで、一からモデルを構築・学習させる必要がなく、開発コストと時間を大幅に削減できます。
- 汎用性と拡張性LLMは特定のタスクに限定されず、多様な自然言語処理タスクに適用可能です。そのため、企業間関係の抽出以外にも、感情分析や要約生成など、追加の分析を行う際にも柔軟に対応できます。
実装:設定とニュース収集
必要なライブラリと初期設定
まずは必要なライブラリをインポートし、APIキーなどの設定を行います:
import requests
import json
from datetime import datetime, timedelta
import time
import pandas as pd
import os
from bs4 import BeautifulSoup
import html2text
from urllib.parse import urlparse
import hashlib
import os
from typing import List, Dict, Optional, Union, Any, Tuple
import openai
from openai import OpenAI
import seaborn as sns
import matplotlib.pyplot as plt
import re
import html

model = "gpt-4o-mini"
OPENAI_KEY = "xxx"
client = OpenAI(api_key=OPENAI_KEY)
NEWSAPI_KEY = "aaa"
FINNHUB_KEY = "bbb"
ALPHAVANTAGE_KEY = "ccc"
POLYGON_API_KEY = "ddd"
ニュース収集クラスの実装
複数のニュースソースから情報を収集するためのMultiSourceNewsCollectorクラスを実装します:
class MultiSourceNewsCollector:
    def __init__(self, newsapi_key: str, finnhub_key: str, alphavantage_key: str):
        self.newsapi_key = newsapi_key
        self.finnhub_key = finnhub_key
        self.alphavantage_key = alphavantage_key
        self.news_data = []

    def fetch_newsapi_news(self, company_name: str, days: int = 7) -> List[Dict]:
        """NewsAPIからニュースを取得"""
        base_url = "https://newsapi.org/v2/everything"

        # 日付範囲の計算
        end_date = datetime.now()
        start_date = end_date - timedelta(days=days)

        params = {
            "q": f'"{company_name}"',
            "from": start_date.strftime("%Y-%m-%d"),
            "to": end_date.strftime("%Y-%m-%d"),
            "language": "en",
            "sortBy": "relevancy",
            "apiKey": self.newsapi_key
        }

        try:
            response = requests.get(base_url, params=params)
            response.raise_for_status()
            data = response.json()

            if data.get("status") == "ok":
                return data.get("articles", [])
            return []

        except Exception as e:
            print(f"Error fetching NewsAPI news for {company_name}: {str(e)}")
            return []

    def fetch_finnhub_news(self, symbol: str, days: int = 7) -> List[Dict]:
        """Finnhubからニュースを取得"""
        base_url = "https://finnhub.io/api/v1/company-news"

        end_date = datetime.now()
        start_date = end_date - timedelta(days=days)

        params = {
            "symbol": symbol,
            "from": start_date.strftime("%Y-%m-%d"),
            "to": end_date.strftime("%Y-%m-%d"),
            "token": self.finnhub_key
        }

        try:
            response = requests.get(base_url, params=params)
            response.raise_for_status()
            return response.json()

        except Exception as e:
            print(f"Error fetching Finnhub news for {symbol}: {str(e)}")
            return []

    def fetch_alphavantage_news(self, symbol: str, days: int = 7) -> List[Dict]:
        """Alpha Vantageからニュースを取得"""
        base_url = "https://www.alphavantage.co/query"

        end_date = datetime.now()
        start_date = end_date - timedelta(days=days)

        params = {
            "function": "NEWS_SENTIMENT",
            "tickers": symbol,
            "time_from": start_date.strftime("%Y%m%dT%H%M"),
            "time_to": end_date.strftime("%Y%m%dT%H%M"),
            "sort": "LATEST",
            "apikey": self.alphavantage_key
        }

        try:
            response = requests.get(base_url, params=params)
            response.raise_for_status()
            data = response.json()

            if "feed" in data:
                return data["feed"]
            return []

        except Exception as e:
            print(f"Error fetching Alpha Vantage news for {symbol}: {str(e)}")
            return []

    def normalize_news_data(self, news_item: Dict, source: str, company: str) -> Dict:
        """異なるソースのニュースデータを統一フォーマットに変換"""
        normalized = {
            "company": company,
            "source_api": source,
            "title": "",
            "url": "",
            "published_at": "",
            "source_name": "",
            "content": ""
        }

        if source == "newsapi":
            normalized.update({
                "title": news_item.get("title", ""),
                "url": news_item.get("url", ""),
                "published_at": news_item.get("publishedAt", ""),
                "source_name": news_item.get("source", {}).get("name", ""),
                "content": news_item.get("description", "")
            })

        elif source == "finnhub":
            normalized.update({
                "title": news_item.get("headline", ""),
                "url": news_item.get("url", ""),
                "published_at": datetime.fromtimestamp(news_item.get("datetime", 0)).isoformat(),
                "source_name": news_item.get("source", ""),
                "content": news_item.get("summary", "")
            })

        elif source == "alphavantage":
            normalized.update({
                "title": news_item.get("title", ""),
                "url": news_item.get("url", ""),
                "published_at": news_item.get("time_published", ""),
                "source_name": news_item.get("source", ""),
                "content": news_item.get("summary", "")
            })

        return normalized

    def collect_company_news(self, symbol: str, company_name: str, days: int = 7):
        """指定した企業のニュースを全ソースから収集"""
        finnhub_news = self.fetch_finnhub_news(symbol, days)
        alphavantage_news = self.fetch_alphavantage_news(symbol, days)

        for news in finnhub_news:
            normalized = self.normalize_news_data(news, "finnhub", company_name)
            self.news_data.append(normalized)

        for news in alphavantage_news:
            normalized = self.normalize_news_data(news, "alphavantage", company_name)
            self.news_data.append(normalized)

        time.sleep(1)  # APIレート制限への配慮

    def save_to_csv(self, output_dir: str = "news_data") -> str:
        """収集したニュースデータをCSVファイルとして保存"""
        if not self.news_data:
            print("No news data to save")
            return ""

        os.makedirs(output_dir, exist_ok=True)

        df = pd.DataFrame(self.news_data)
        timestamp = datetime.now().strftime("%Y%m%d_%H%M%S")
        filename = f"multi_source_news_{timestamp}.csv"
        filepath = os.path.join(output_dir, filename)

        df.to_csv(filepath, index=False, encoding='utf-8-sig')

        print(f"\nNews data saved to: {filepath}")
        print(f"Total articles collected: {len(self.news_data)}")

        print("\nSummary by company and source:")
        summary = df.groupby(['company', 'source_api']).size().unstack(fill_value=0)
        print(summary)

        return filepath
このクラスの主な特徴と利点は以下の通りです:
- 複数ソースの統合:複数のニュースAPIからデータを取得し、統一されたフォーマットで管理します。
- エラーハンドリング:各APIリクエストでの例外処理を実装し、安定した動作を確保します。
- データの正規化:異なるフォーマットのデータを統一された形式に変換します。
- APIレート制限への配慮:適切な待機時間を設けることで、APIの制限を考慮しています。
ニュース処理とLLM解析の実装
収集したニュースデータを処理し、LLMを使用して企業間の関係性を抽出するNewsProcessorクラスを実装します。このクラスは先ほどのMultiSourceNewsCollectorを継承して、追加の機能を提供します。
class NewsProcessor(MultiSourceNewsCollector):
    def __init__(self, openai_client: OpenAI):
        super().__init__(NEWSAPI_KEY, FINNHUB_KEY, ALPHAVANTAGE_KEY)
        self.openai_client = openai_client
        self.processed_news = []

    def _generate_news_id(self, article: Dict[str, Any]) -> str:
        """ニュース記事のユニークID生成"""
        unique_string = f"{article.get('title', '')}{article.get('time_published', '')}{article.get('url', '')}"
        return hashlib.md5(unique_string.encode()).hexdigest()

    def format_response(self, article_content: str, companies: List[Tuple[str, str]], model: str) -> Dict:
        """LLMを使用してニュース記事を解析"""
        primer = """
        You are a bot that accurately responds to requests. Please interpret the news text provided by the user faithfully and output the following items in JSON format.

        Output format:
        {
            "contents": "Full text of the news content",
            "important_contents": ["Important content1", "Important content2"],
            "related_companies": ["Company1", "Company2"],
            "company": {
                "Company1": "Relationship between companies",
                "Company2": "Relationship between companies"
            }
        }

        Analysis target:
        1. Remove irrelevant parts and output all the content without summarizing.
        2. Extract important contents especially affecting stock price for the company in "{0}".
        3. Extract company names related to "{0}" from the content.
        4. Specify the relationship between the companies (e.g., competitive, supplier, partnership, etc.).

        News text: {1}
        company: {0}
        """.format(str(companies[0]), article_content)

        try:
            response = self.openai_client.chat.completions.create(
                model=model,
                messages=[{"role": "user", "content": primer}]
            )
            assistant_message = response.choices[0].message.content

            # JSON文字列を抽出して解析
            json_str = re.search(r'\{.*\}', assistant_message, re.DOTALL)
            if json_str:
                try:
                    json_data = json.loads(json_str.group())
                    if not all(key in json_data for key in ['contents', 'related_companies', 'company']):
                        raise KeyError("Required keys missing in JSON response")
                    return json_data
                except json.JSONDecodeError:
                    print("JSON解析エラー")
            else:
                print("JSON形式の応答が見つかりません")

            return {
                "contents": article_content,
                "important_contents": [],
                "related_companies": [],
                "company": {}
            }

        except Exception as e:
            print(f"Error in format_response: {str(e)}")
            return {
                "contents": article_content,
                "important_contents": [],
                "related_companies": [],
                "company": {}
            }

    def process_news(self, articles: List[Dict], companies: List[Tuple[str, str]], model: str) -> None:
        """ニュース記事を処理してLLMで解析"""
        if not articles:
            print(f"No news articles available for {companies[0][1]}")
            return

        for article in articles:
            article_id = self._generate_news_id(article)
            url = article.get('url')
            content = article.get('content', '')

            analysis_result = self.format_response(content, companies, model)

            processed_item = {
                'id': article_id,
                'company': companies[0][1],
                'title': article.get('title', 'N/A'),
                'source': article.get('source', 'N/A'),
                'time_published': article.get('time_published', 'N/A'),
                'url': url or 'N/A',
                'sentiment_score': article.get('overall_sentiment_score', 'N/A'),
                'analysis': analysis_result
            }

            self.processed_news.append(processed_item)
            time.sleep(1)

    def save_processed_news(self, output_dir: str = "processed_news") -> str:
        """処理済みニュースデータをJSONファイルとして保存"""
        if not self.processed_news:
            print("No processed news data to save")
            return ""

        os.makedirs(output_dir, exist_ok=True)
        timestamp = datetime.now().strftime("%Y%m%d_%H%M%S")
        filename = f"processed_news_{timestamp}.json"
        filepath = os.path.join(output_dir, filename)

        with open(filepath, 'w', encoding='utf-8') as f:
            json.dump(self.processed_news, f, ensure_ascii=False, indent=2)

        print(f"\nProcessed news data saved to: {filepath}")
        print(f"Total articles processed: {len(self.processed_news)}")

        return filepath
このクラスの主な機能と特徴を説明します:
- LLMによる解析
- ニュース記事の本文からLLMを使用して重要な情報を抽出
- 企業間の関係性を自動的に特定
- 重要なイベントや影響を分析
- データ処理とフォーマット
- 各記事にユニークIDを割り当て
- 統一されたJSON形式でデータを管理
- エラー処理と例外ハンドリング
- 効率的なデータ保存
- 処理結果を構造化されたJSONとして保存
- タイムスタンプ付きのファイル名で管理
- 日本語などの多言語対応(UTF-8エンコーディング)
使用例は以下の通りです:
# プロセッサーの初期化
processor = NewsProcessor(client)

# ニュースの収集と処理
symbol = "AAPL"
company_name = "Apple Inc."
articles = processor.fetch_alphavantage_news(symbol)
processor.process_news(articles, [(symbol, company_name)], "gpt-4o-mini")

# 処理結果の保存
output_file = processor.save_processed_news()
企業間関係ネットワークの分析と可視化
企業間の関係性を分析し、インタラクティブなネットワークグラフとして可視化するCompanyNetworkAnalyzerクラスを実装します。このクラスはNetworkXとPlotlyを使用して、複雑な企業間関係を理解しやすい形で表現します。
import plotly.graph_objects as go
import networkx as nx
from typing import Dict, List, Set, Tuple
import json
import numpy as np
from collections import defaultdict

class CompanyNetworkAnalyzer:
    def __init__(self, json_data: List[Dict], openai_client: OpenAI):
        self.data = json_data
        self.client = openai_client
        self.G = nx.Graph()  # 無向グラフを使用
        self.company_importance = defaultdict(float)
        self.relationship_importance = defaultdict(float)
        self.edge_contents = defaultdict(list)  # エッジの詳細情報を保存

    def analyze_importance(self, content: str, company1: str, company2: str) -> float:
        """OpenAIを使用して関係の重要性をスコア化"""
        try:
            prompt = f"""
            Rate the importance of the relationship between {company1} and {company2}
            based on the following content, on a scale of 0.0 to 1.0. Consider factors like:
            - Direct financial impact
            - Strategic importance
            - Market influence
            - Competitive dynamics

            Content: {content}

            Output only the numerical score between 0.0 and 1.0.
            """

            response = self.client.chat.completions.create(
                model="gpt-4o-mini",
                messages=[{"role": "user", "content": prompt}],
                max_tokens=10
            )

            score = float(response.choices[0].message.content.strip())
            return min(max(score, 0.0), 1.0)

        except Exception as e:
            print(f"Error analyzing importance: {str(e)}")
            return 0.5

    def build_network(self):
        """企業間のネットワークを構築"""
        self.G.clear()
        all_companies = set()
        company_relations = defaultdict(set)

        # 企業と関係性の収集
        for item in self.data:
            main_company = item['company']
            analysis = item['analysis']
            all_companies.add(main_company)

            if 'related_companies' in analysis and analysis['related_companies']:
                for related_company in analysis['related_companies']:
                    all_companies.add(related_company)
                    company_relations[main_company].add(related_company)
                    company_relations[related_company].add(main_company)

        # ノードの追加
        for company in all_companies:
            node_type = 'main' if any(item['company'] == company for item in self.data) else 'related'
            self.G.add_node(company, type=node_type)

        # エッジの追加
        for item in self.data:
            main_company = item['company']
            analysis = item['analysis']

            if 'related_companies' in analysis and analysis['related_companies']:
                for related_company in analysis['related_companies']:
                    importance = self.analyze_importance(
                        str(analysis.get('contents', '')),
                        main_company,
                        related_company
                    )

                    relationship = analysis['company'].get(related_company, '')
                    edge_key = tuple(sorted([main_company, related_company]))

                    # エッジ情報の更新
                    self.edge_contents[edge_key].append({
                        'relationship': relationship,
                        'importance': importance,
                        'content': str(analysis.get('contents', '')),
                        'date': item.get('time_published', '')
                    })

                    # 重要度の更新
                    self.relationship_importance[edge_key] = max(
                        self.relationship_importance[edge_key],
                        importance
                    )
                    self.company_importance[related_company] += importance

    def create_interactive_network(self):
        """Plotlyを使用したインタラクティブなネットワーク図の作成"""
        # ネットワークレイアウトの計算
        pos = nx.spring_layout(self.G, k=1, iterations=50)

        # ノードの設定
        node_x = []
        node_y = []
        node_colors = []
        node_sizes = []
        node_texts = []

        for node in self.G.nodes():
            x, y = pos[node]
            node_x.append(x)
            node_y.append(y)

            if self.G.nodes[node]['type'] == 'main':
                node_colors.append('lightblue')
                node_sizes.append(40)
            else:
                importance = self.company_importance[node]
                node_colors.append(f'rgb{tuple(int(x * 255) for x in plt.cm.YlOrRd(importance)[:3])}')
                node_sizes.append(30 + importance * 20)

            node_texts.append(f"Company: {node}
"
                            f"Type: {self.G.nodes[node]['type']}
"
                            f"Importance: {self.company_importance[node]:.2f}")

        # エッジの設定
        edge_x = []
        edge_y = []
        edge_texts = []

        for edge in self.G.edges():
            x0, y0 = pos[edge[0]]
            x1, y1 = pos[edge[1]]
            edge_x.extend([x0, x1, None])
            edge_y.extend([y0, y1, None])

            edge_key = tuple(sorted(edge))
            edge_info = self.edge_contents[edge_key]
            edge_text = f"Relationship between {edge[0]} and {edge[1]}
"
            for info in edge_info:
                edge_text += f"Type: {info['relationship']}
"
                edge_text += f"Importance: {info['importance']:.2f}
"
                edge_text += f"Date: {info['date']}

"
            edge_texts.append(edge_text)

        # グラフの作成
        fig = go.Figure()

        # エッジの追加
        fig.add_trace(go.Scatter(
            x=edge_x, y=edge_y,
            line=dict(width=2, color='#888'),
            hoverinfo='text',
            text=edge_texts,
            mode='lines'
        ))

        # ノードの追加
        fig.add_trace(go.Scatter(
            x=node_x, y=node_y,
            mode='markers+text',
            hoverinfo='text',
            text=[node for node in self.G.nodes()],
            textposition="top center",
            hovertext=node_texts,
            marker=dict(
                showscale=True,
                colorscale='YlOrRd',
                size=node_sizes,
                color=node_colors,
                line_width=2
            )
        ))

        # レイアウトの設定
        fig.update_layout(
            title="Interactive Company Relationship Network",
            showlegend=False,
            hovermode='closest',
            margin=dict(b=20,l=5,r=5,t=40),
            annotations=[dict(
                text="Node size and color intensity indicate importance",
                showarrow=False,
                xref="paper", yref="paper",
                x=0.005, y=-0.002
            )],
            xaxis=dict(showgrid=False, zeroline=False, showticklabels=False),
            yaxis=dict(showgrid=False, zeroline=False, showticklabels=False),
            width=1000,
            height=800
        )

        return fig

    def create_graph_data(self) -> dict:
        """D3.js用のグラフデータを生成"""
        nodes = []
        links = []
        node_ids = {}  # ノードIDのマッピング

        # ノードの生成
        for i, node in enumerate(self.G.nodes()):
            node_type = self.G.nodes[node]['type']
            node_data = {
                'id': node,
                'cluster': 1 if node_type == 'main' else 2,
                'isBridge': False,  # ブリッジノードの判定は後で
                'importance': float(self.company_importance[node])
            }
            nodes.append(node_data)
            node_ids[node] = i

        # エッジの生成
        for edge in self.G.edges():
            source, target = edge
            edge_key = tuple(sorted([source, target]))
            edge_data = {
                'source': source,
                'target': target,
                'isBridge': False,  # ブリッジの判定は後で
                'importance': float(self.relationship_importance[edge_key]),
                'details': self.edge_contents[edge_key]
            }
            links.append(edge_data)

        # ブリッジノードの検出(次数の高いノード)
        degree_centrality = nx.degree_centrality(self.G)
        threshold = np.percentile(list(degree_centrality.values()), 75)
        for node in self.G.nodes():
            if degree_centrality[node] > threshold:
                for n in nodes:
                    if n['id'] == node:
                        n['isBridge'] = True
                        break

        return {
            'nodes': nodes,
            'links': links
        }

    def generate_html(self):
        """HTMLファイルを生成"""
        graph_data = self.create_graph_data()

        html_content = '''
# ここにHTMLとJavascriptのコードを入れる
'''

        # HTMLファイルを保存
        with open('company_network.html', 'w', encoding='utf-8') as f:
            f.write(html_content)

        print("Network visualization has been saved to 'company_network.html'")


with open('./processed_news/processed_news_20241109_152715.json', 'r') as file:
    news_data = json.load(file)

analyzer = CompanyNetworkAnalyzer(news_data, client)
analyzer.build_network()
analyzer.generate_html()
このクラスの主な機能と特徴を説明します:
- 重要度分析
- LLMを使用して企業間関係の重要度を0.0から1.0でスコア化
- 財務的影響、戦略的重要性、市場への影響などを考慮
- ネットワーク構築
- 企業をノード、関係性をエッジとしてグラフを構築
- メインの企業と関連企業を区別して表示
- 重要度に基づいてノードとエッジの視覚的属性を設定
- インタラクティブな可視化
- Plotlyを使用したインタラクティブなネットワーク図
- ホバー時の詳細情報表示
- ズームやパンに対応した操作性
使用例は以下の通りです:
# JSONファイルから処理済みニュースデータを読み込み
with open('./processed_news/processed_news_20241109_152715.json', 'r') as file:
    news_data = json.load(file)

# アナライザーの初期化とネットワーク構築
analyzer = CompanyNetworkAnalyzer(news_data, client)
analyzer.build_network()

# インタラクティブなネットワーク図の生成
fig = analyzer.create_interactive_network()
analyzer.generate_html()
fig.show() # ブラウザで表示
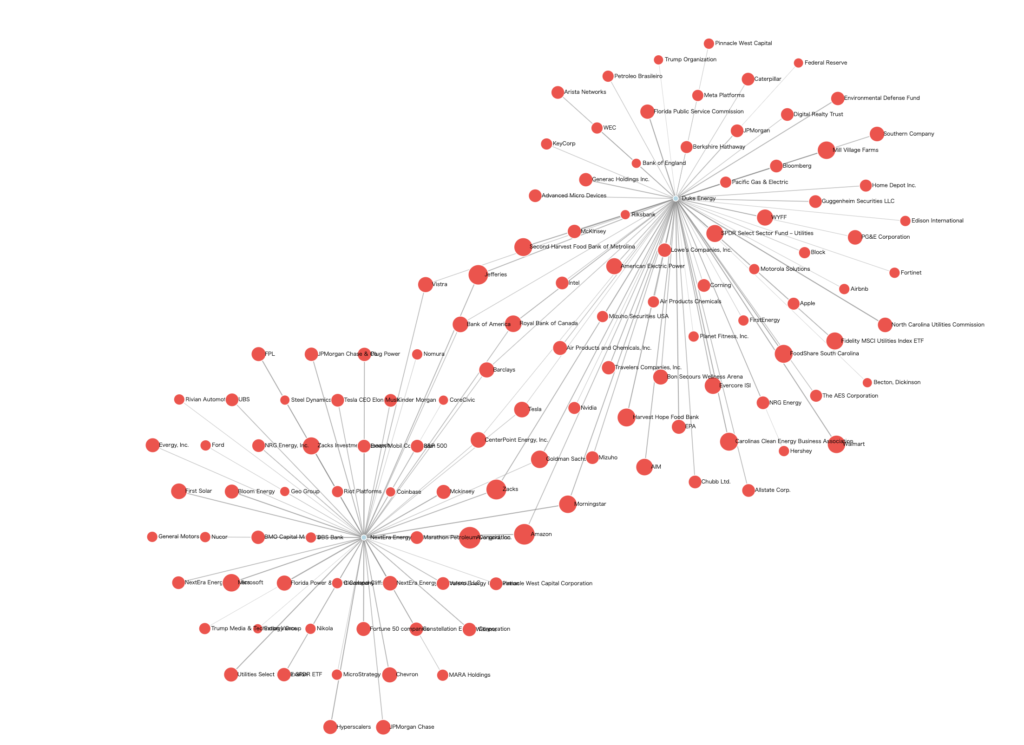
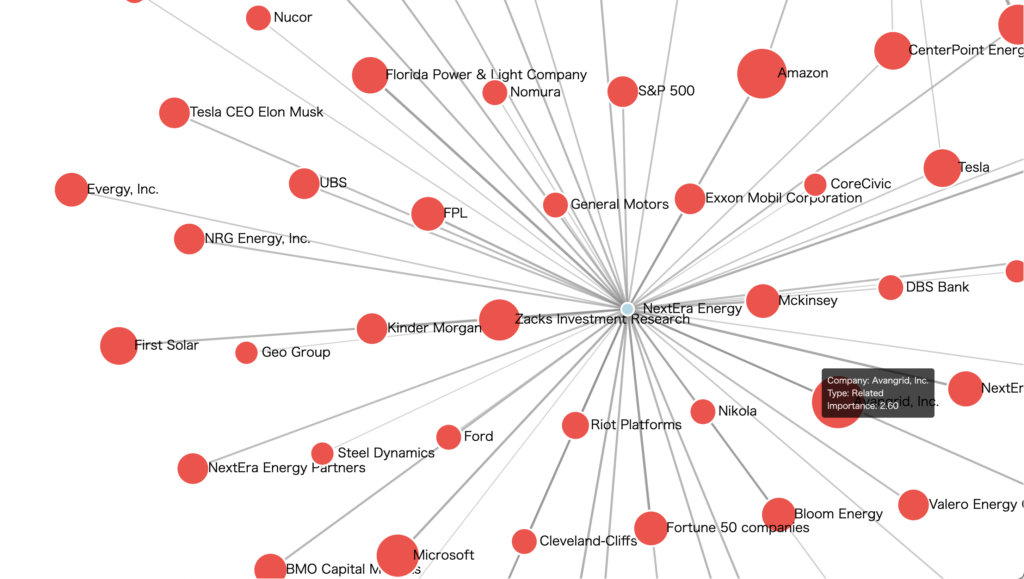
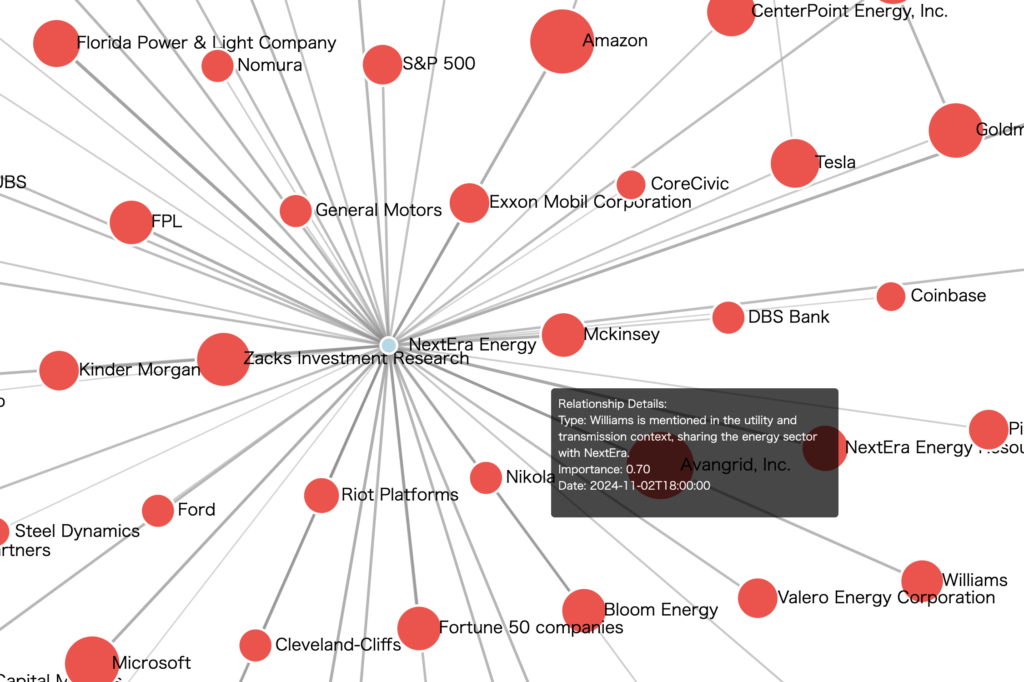
↓はスクリーンキャプチャによるデモ動画です。インタラクティブに企業間関係を見ることができます。
まとめと今後の展望
本記事では、LLMを活用してニュース記事から企業間の関係性を抽出し、インタラクティブなネットワークグラフとして可視化するシステムの実装について解説しました。この手法により、以下のような価値を提供することができます:
- 効率的な情報収集: 複数のニュースソースから自動的にデータを収集し、統合された形式で管理
- 高度な解析: LLMを活用することで、テキストから複雑な関係性を抽出
- 直観的な可視化: インタラクティブなネットワークグラフにより、複雑な関係性を理解しやすく表現
- リアルタイムの洞察: 最新のニュースに基づいて、企業間の関係性を継続的に更新・モニタリング
現在の制限事項
システムの利用に際して、以下の点に注意が必要です:
- API制限: 各ニュースAPIやOpenAI APIの利用制限に注意が必要です。
- 処理時間: LLMによる解析には一定の時間がかかるため、大量のニュース記事を処理する場合は考慮が必要です。
- 精度: LLMの解析結果は完璧ではなく、時として誤った関係性を抽出する可能性があります。
- コスト: API利用料金が発生するため、大規模な分析を行う場合はコストを考慮する必要があります。
今後の改善点
このシステムをさらに発展させるために、以下のような改善を検討できます:
- 解析の高度化
- 感情分析の導入による関係性の質的評価
- 時系列分析による関係性の変化の追跡
- 業界特有の文脈を考慮した解析の実装
- 可視化の拡張
- 時間軸を考慮したダイナミックなネットワーク表示
- 関係性の種類に基づいたフィルタリング機能
- サブグラフ分析機能の追加
- システムの最適化
- 並列処理による処理速度の向上
- キャッシュ機構の導入によるAPI呼び出しの最適化
- エラーハンドリングの強化
実践的な活用方法
このシステムは、以下のようなビジネスシーンでの活用が期待できます:
- 競合分析: 競合企業の関係性や動向を把握し、戦略立案に活用
- M&A機会の発見: 企業間の関係性から潜在的なM&A機会を特定
- リスク管理: サプライチェーンの依存関係やリスクの可視化
- 市場動向分析: 業界全体のエコシステムや構造変化の把握
おわりに
企業間関係の分析と可視化は、ビジネス戦略の立案や意思決定において重要な役割を果たします。本記事で紹介したシステムは、最新のAI技術を活用することで、この複雑なタスクを効率的に実行する方法を提供します。
本コードが、皆様のビジネス分析や意思決定の一助となれば幸いです。
グループ研究開発本部 AI研究開発室では、データサイエンティスト/機械学習エンジニアを募集しています。ビッグデータの解析業務などAI研究開発室にご興味を持って頂ける方がいらっしゃいましたら、ぜひ募集職種一覧からご応募をお願いします。皆さんのご応募をお待ちしています。
グループ研究開発本部の最新情報をTwitterで配信中です。ぜひフォローください。
Follow @GMO_RD

